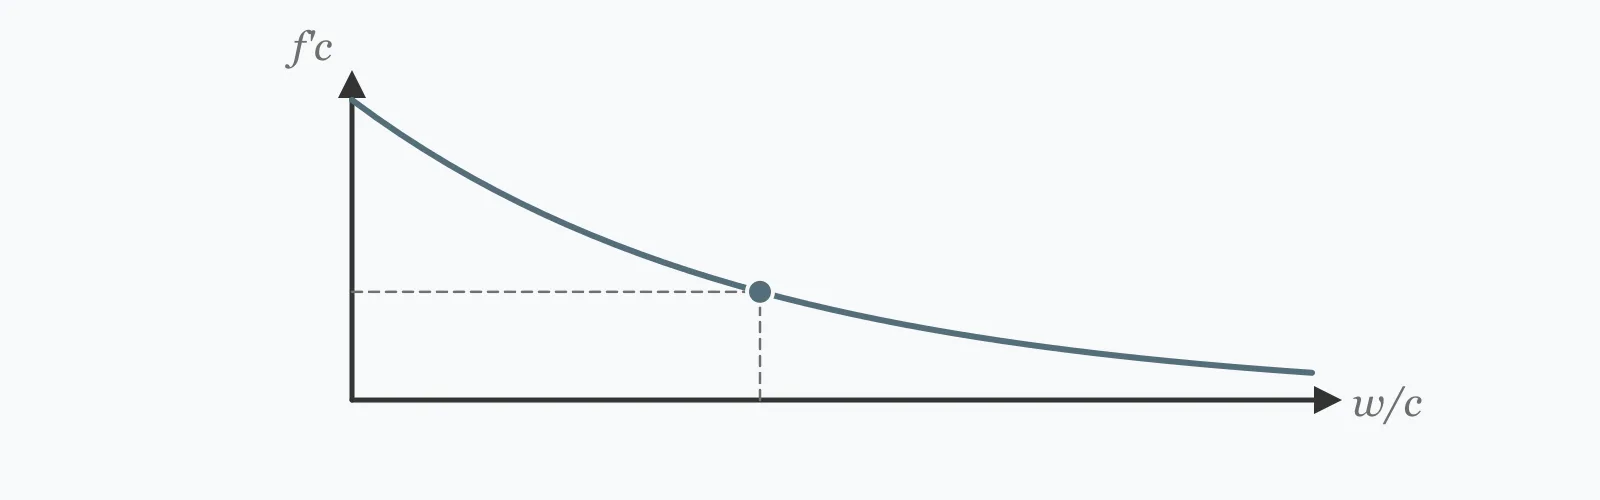
Concrete strength is governed by the water-cement ratio through Abrams' law, and it develops over time following the ACI 209 curve. Enter the w/c ratio, the age in days and a cement type factor to get the 28-day strength, the strength at that age, and the percentage of the 28-day value reached. It is an estimate, not a substitute for cylinder testing.
Calculator
Units:
—
By mass. 0.40 high strength, 0.50 general, 0.65 mass fill
days
Days since placing, under continuous moist curing
—
1.0 ordinary Portland; higher for rapid-hardening, lower for blended
Calculation Result
Press Calculate for the estimated 28-day strength, the strength at the age you entered, and that age as a percentage of the 28-day value. Use it for planning; use cylinder tests for acceptance.
Step-by-Step Solution
Preliminary design aid. Results follow the published formulas cited
below and are intended for estimating, study and early design. Final design must be
verified by a licensed Professional Engineer against the code in force for your project.
Key Benefits
✓Uses Abrams' law fitted to the ACI 211.1 water-cement ratio table
✓Applies the ACI 209 time function for strength development
✓Returns the percentage of 28-day strength, the figure site decisions turn on
✓Handles cement type through an adjustable factor
✓Sensitivity chart shows the strength gain curve across the full age range
✓Shareable links and CSV export for planning records
What Is Concrete Strength?
Abrams' law states that for fully compacted concrete, compressive strength is a function of the water-cement ratio alone, essentially independent of the mix proportions or aggregate quantities. It takes the form f'c = A/B^(w/c), where A and B are constants fitted to a particular cement and curing regime. The constants used here, A = 120 and B = 13.8, are fitted to the water-cement ratios tabulated in ACI 211.1, and reproduce that table within 4% across the full range.
How strength develops with age
Hydration continues for months, and ACI 209 describes the resulting strength gain as f(t) = f₂₈·t/(a + b·t), with a = 4.0 and b = 0.85 for Type I cement under moist curing. That curve gives about 46% of the 28-day strength at 3 days, 70% at 7 days and 88% at 14 days, then continues rising slowly — roughly 112% at 90 days and 116% at a year. Most of the useful strength arrives in the first week.
Where the estimate stops being reliable
Abrams' law holds for fully compacted concrete under standard moist curing with ordinary Portland cement. Poor compaction leaves voids that reduce strength dramatically regardless of the mix — a 5% void content costs roughly 30% of the strength. Curing that lets the surface dry stops hydration, and cold weather slows it. Supplementary cementitious materials shift the curve substantially, with fly ash and slag gaining strength more slowly early and continuing longer.
Formula
f'c(28) = 120 / 13.8^(w/c)
Abrams' law, with constants fitted to the ACI 211.1 water-cement ratio table
Related Formulas
f(t) = f₂₈ · t / (4.0 + 0.85t)
f(t)/f₂₈ × 100
f'cr = f'c + 1.34s
Variable Definitions
Symbol
Variable
Unit
Description
f'c(28)
28-Day Strength
MPa
Estimated compressive strength at 28 days, the reference age for specification.
w/c
Water-Cement Ratio
—
Mass of water divided by mass of cement. The dominant variable in Abrams' law.
t
Curing Age
days
Age of the concrete since placing, under continuous moist curing.
f(t)
Strength at Age
MPa
Compressive strength developed at the given age.
cement type
Cement Type Factor
—
Multiplier for cement type: 1.0 for ordinary Portland, above 1 for rapid-hardening, below for slower blends.
How to Use This Calculator
Enter the water-cement ratio by massThis is free water divided by cementitious mass. Remember that aggregate moisture contributes to free water — damp sand can raise the effective ratio by 0.05 or more above the batched value.
Enter the age since placingThe ACI 209 curve assumes continuous moist curing from placing. Concrete allowed to dry stops gaining strength, so a member cured for three days and then left exposed will fall short of the curve from that point on.
Adjust the cement type factorLeave it at 1.0 for ordinary Portland cement. Rapid-hardening cement gains faster early, while blends containing fly ash or slag gain more slowly at first and continue longer — the factor is a blunt instrument for a nuanced effect.
Use the percentage for site decisionsFormwork striking, prestress transfer and early loading are all decided on a fraction of the design strength. The percentage output is the number those decisions use, and it is more robust than the absolute value.
Confirm with cylinder testsThis is a planning estimate. Acceptance requires tested cylinders or cubes, and site decisions on early loading should rest on tested field-cured specimens rather than on a curve.
Worked Examples
Example 1
A concrete mix has a water-cement ratio of 0.50 with ordinary Portland cement. Estimate the 28-day strength and the strength at 7 days.
Step-by-Step Solution
Abrams' law: f'c(28) = 120 / 13.8^0.50
13.8^0.50 = √13.8 = 3.715
f'c(28) = 120 / 3.715 = 32.3 MPa
ACI 209 time function at 7 days: f(7) = 32.3 × 7 / (4.0 + 0.85 × 7)
Percentage of 28-day strength: 22.7 / 32.3 = 70.3%
Assessment: a 7-day cylinder breaking around 22 to 23 MPa is on track for a 32 MPa mix. A result of 15 MPa would signal a problem worth investigating before the 28-day break confirms it.
Example 2
Comparing two mixes for a slab that must be struck at 3 days. This is where the water-cement ratio decision has a schedule consequence, not just a strength one.
Step-by-Step Solution
Mix A at w/c 0.60: f'c(28) = 120 / 13.8^0.60 = 120 / 4.845 = 24.8 MPa
At 3 days: f(3) = 24.8 × 3 / (4.0 + 2.55) = 24.8 × 3 / 6.55 = 11.4 MPa, or 46% of the 28-day value
Mix B at w/c 0.45: f'c(28) = 120 / 13.8^0.45 = 120 / 3.258 = 36.8 MPa
At 3 days: f(3) = 36.8 × 3 / 6.55 = 16.9 MPa, again 46%
The percentage is identical because the time function scales the whole curve — lowering w/c raises the ceiling without changing the shape.
But the absolute early strength differs by 48%, from 11.4 to 16.9 MPa. If striking requires 15 MPa, Mix A cannot be struck at 3 days and Mix B can.
That is a real project decision: the lower water-cement ratio costs more in cement but buys a day or two on every pour, which on a repetitive floor cycle usually pays for itself.
Strength Gain Curve
Strength rises steeply through the first week, then flattens into a long slow gain. The shape is why formwork striking decisions are made at 3 to 7 days rather than waiting for 28. The marker shows your current age.
Strength at Given Age vs Curing Age
Recomputed live from your inputs. The marker shows your current value.
Line chart of Strength at Given Age against Curing Age. The same
values are listed in the data table below.
Values plotted above, sampled across the curing age range.
How to Interpret Your Results
The percentage of 28-day strength is what site decisions turn on, because striking and loading criteria are written as fractions of the design strength. The bands below relate the age to what it permits.
% of 28-Day Strength: < 40Very early age — minimal strength
At your result% of the 28-day strength the concrete is barely into its strength gain. Formwork to vertical faces may be struck, but nothing should be loaded and no soffit formwork removed. Protect the surface from drying, since curing in the first days sets the entire subsequent curve.
At your result% of the 28-day strength, soffit formwork can usually be struck for slabs with propping retained, subject to the specified striking strength being confirmed by field-cured cylinders. Continue curing after striking.
% of 28-Day Strength: 70 – 95Substantial strength developed
At your result% of the 28-day strength the concrete carries most of its design capacity. Back-propping can typically be removed and construction loading applied, provided the specific striking criteria for the member have been met.
% of 28-Day Strength: ≥ 95At or beyond design strength
At your result% the concrete has effectively reached its specified strength. Gains continue but slowly — around 112% at 90 days and 116% at a year. Note that acceptance testing is normally at 28 days, so later strength is reserve rather than capacity you can design for.
An estimated 28-day strength of your result MPa suits mass fill and non-structural work. Most reinforced concrete requires at least 25 MPa, and durability exposure classes frequently impose a higher minimum than the structural design alone would need.
Common Mistakes to Avoid
Treating the estimate as an acceptance result
Why it matters:Abrams' law describes a well-made, well-cured mix. Actual strength depends on compaction, curing, temperature and materials, none of which the formula sees. Concrete is accepted on tested specimens, not on prediction.
✓How to avoid it:Use this for planning and for sanity-checking a break result. Acceptance requires cylinders or cubes tested to the relevant standard.
Ignoring aggregate moisture in the w/c ratio
Why it matters:Damp sand carries 4 to 6% moisture, which on a typical mix adds 30 to 50 litres of unaccounted water per cubic metre. That raises the effective ratio by 0.05 or more, which at w/c 0.50 costs about 4 MPa.
✓How to avoid it:Use the effective water-cement ratio including aggregate moisture, not the nominal batched figure. This is the main reason site-mixed concrete underperforms its design.
Assuming the curve applies without continuous curing
Why it matters:The ACI 209 function assumes moist curing throughout. Concrete allowed to dry stops hydrating, and strength gain simply stops with it — a slab cured three days and then exposed may plateau near 60% of its potential.
✓How to avoid it:Cure for the specified period, typically seven days minimum. Where curing has been interrupted, expect the actual strength to fall below the curve from that point.
Applying the standard curve to blended cements
Why it matters:Fly ash and slag hydrate more slowly, so a blended mix gains less early strength but continues gaining well past 28 days. Using the Type I curve overstates 3 and 7-day strength and understates the long-term value.
✓How to avoid it:Adjust the cement type factor, and where early strength matters, test field-cured specimens rather than relying on any curve.
Ignoring temperature
Why it matters:Hydration is a chemical reaction and slows sharply in the cold. Concrete at 5 °C may reach only half the 3-day strength of the same mix at 20 °C, and below freezing it stops entirely.
✓How to avoid it:Use a maturity method that accounts for temperature history, or test field-cured cylinders kept alongside the structure rather than standard-cured ones from the laboratory.
Designing to exactly the specified strength
Why it matters:Batch-to-batch variability means a mix targeting exactly f'c fails acceptance roughly half the time, since half of all results fall below the mean.
✓How to avoid it:Design the mix for the required average strength f'cr = f'c + 1.34s per ACI 318 §26.4.3, using the producer's standard deviation.
Practical Applications
▸Estimating strength gain for formwork striking decisions
▸Planning prestress transfer timing in precast production
▸Sanity-checking a 7-day cylinder result against expectation
▸Comparing water-cement ratios during mix selection
▸Assessing whether a floor cycle time is achievable
▸Estimating the strength of existing concrete from a known mix
Industry Use Cases
In-situ building construction
Floor cycle times are set by how quickly formwork can be struck and reused, which depends entirely on early strength. Lowering the water-cement ratio costs cement but buys a day or two per pour, and on a repetitive multi-storey frame that usually pays for itself several times over.
Precast concrete
Beds must be turned around daily, so demoulding strength at 16 to 20 hours governs the mix rather than the 28-day specification. Water-cement ratios well below what the structural requirement implies are normal, purely to hit the release strength on schedule.
Quality control and dispute resolution
When a 28-day result falls short, the investigation works backwards through w/c ratio, aggregate moisture, compaction and curing records. Comparing the achieved strength against the Abrams prediction for the batched mix quickly narrows where the loss occurred.
Expert Tips
💡Roughly 70% of the 28-day strength arrives by day 7, and 46% by day 3 — the curve is front-loaded.
💡The percentage of 28-day strength is independent of the water-cement ratio; only the ceiling moves.
💡A 0.05 increase in effective w/c costs around 4 MPa at typical ratios — aggregate moisture alone can do that.
💡Cure for at least seven days. Curing interrupted early caps the strength permanently, not temporarily.
💡Cold weather slows hydration sharply; use field-cured specimens rather than laboratory ones for site decisions.
💡Concrete continues gaining strength for years, but design and acceptance both use the 28-day value.
Advantages & Limitations
Advantages
✓Captures the single most influential variable in concrete strength
✓Constants fitted to ACI 211.1, agreeing with that table within 4%
✓Combines the strength ceiling and the time curve in one calculation
✓Returns the percentage figure that site decisions actually use
✓Fast enough to compare mixes during planning
Limitations
!An estimate for planning; acceptance requires tested specimens
!Assumes full compaction — a 5% void content costs roughly 30% of the strength
!Assumes continuous moist curing from placing
!Fitted to ordinary Portland cement; blended cements follow a different curve
!Takes no account of temperature, which strongly affects early strength
!Ignores admixtures, aggregate quality and grading
!The ACI 209 function returns 100.7% rather than exactly 100% at 28 days, an artefact of its constants
Strength Gain by Age
The ACI 209 curve for Type I cement under moist curing. The percentage column is independent of the mix — lowering the water-cement ratio raises every value in the strength columns without changing the shape.
ACI 209 time function with a = 4.0, b = 0.85. The 100.7% at 28 days is an artefact of the fitted constants, not a real overshoot.
How is concrete strength related to the water-cement ratio?
Through Abrams' law, f'c = A/B^(w/c). Strength falls sharply as the ratio rises: 0.45 gives about 37 MPa, 0.50 gives 32 MPa and 0.60 gives 25 MPa. It is the single most influential variable in the mix.
What percentage of strength does concrete reach at 7 days?
About 70% of the 28-day value for ordinary Portland cement under moist curing. At 3 days it is around 46%, and at 14 days 88%. Most useful strength arrives within the first week.
Why is 28 days the reference age?
It is a convention balancing practicality against completeness. By 28 days most of the achievable strength has developed and the curve has flattened enough that further waiting adds little, while the period is short enough to be useful for acceptance.
Does concrete keep gaining strength after 28 days?
Yes, but slowly — around 112% of the 28-day value at 90 days and 116% at a year. Design and acceptance both use the 28-day figure, so later gain is reserve rather than capacity you can rely on.
How does curing affect strength gain?
Decisively. Hydration needs water, so concrete allowed to dry simply stops gaining strength. A slab cured for three days and then left exposed may plateau near 60% of its potential, and the loss is permanent rather than recoverable.
How does cold weather affect strength gain?
It slows it substantially. Concrete at 5 °C may reach only half the 3-day strength of the same mix at 20 °C, and hydration stops below freezing. Use field-cured specimens kept beside the structure for cold-weather striking decisions.
When can formwork be struck?
When the concrete reaches the specified striking strength, which is a fraction of the design value and depends on the member and whether propping is retained. Confirm it with field-cured cylinders rather than a predicted curve.
Does compaction affect strength?
Dramatically. Every 1% of entrapped air costs roughly 5 to 6% of strength, so 5% voids from poor compaction remove about 30%. No mix design compensates for inadequate vibration.
Why does my 7-day result seem low?
Check the expected value first — 70% of the design strength is normal at 7 days, so a 32 MPa mix should give about 22 MPa. If it is well below that, look at effective water-cement ratio including aggregate moisture, compaction, curing and specimen handling.
Do fly ash and slag change the curve?
Yes. Blended cements hydrate more slowly, giving lower 3 and 7-day strength but continuing to gain well past 28 days. The Type I curve overstates their early strength, so early-age decisions need field-cured testing rather than a prediction.
Glossary
Abrams' law
The relationship establishing that the strength of fully compacted concrete depends on the water-cement ratio almost to the exclusion of other factors.
Water-cement ratio
The mass of free water divided by the mass of cementitious material in a mix.
Characteristic strength (f'c)
The specified compressive strength used in design, normally at 28 days.
Maturity function
A relationship predicting strength development from age and temperature history.
Moist curing
Keeping concrete continuously wet so hydration can proceed, typically for at least seven days.
Striking strength
The strength a member must reach before its formwork may be removed.
Field-cured specimen
A test cylinder kept alongside the structure so it experiences the same temperature and curing conditions.
Required average strength (f'cr)
The mean strength a mix must target so individual results satisfy the specified value with adequate confidence.
Blended cement
Cement containing fly ash, slag or other supplementary materials, which alters the strength development curve.
Scientific & Standards References
Abrams, D. A., Design of Concrete Mixtures, Bulletin 1, Structural Materials Research Laboratory (1918) — Lewis Institute, Chicago
ACI 209R — Prediction of Creep, Shrinkage, and Temperature Effects in Concrete Structures — American Concrete Institute
ACI 211.1 Table 6.3.4(a) — Relationship Between Water-Cement Ratio and Compressive Strength — American Concrete Institute
ACI 318-19 §26.4.3 — Concrete Mixture Requirements and Required Average Strength — American Concrete Institute
ASTM C39/C39M — Standard Test Method for Compressive Strength of Cylindrical Concrete Specimens — ASTM International
Neville, A. M., Properties of Concrete, 5th Edition — Chapter 6 — Pearson
Conclusion
Two relationships determine concrete strength: Abrams' law sets the ceiling from the water-cement ratio, and the ACI 209 time function determines how much of that ceiling has been reached. The curve is front-loaded — 46% at 3 days, 70% at 7 — and its shape does not change with the mix, so lowering the water-cement ratio raises every point on it proportionally. That is what makes it a schedule decision as well as a strength one: a lower ratio costs cement but can buy a day per pour. The estimate assumes full compaction and continuous moist curing, and neither is automatic. Poor compaction can remove 30% of the strength no mix design will recover, and curing interrupted early caps the result permanently.
Estimate your own mix above, then sweep the age in the chart to see where the strength gain flattens.