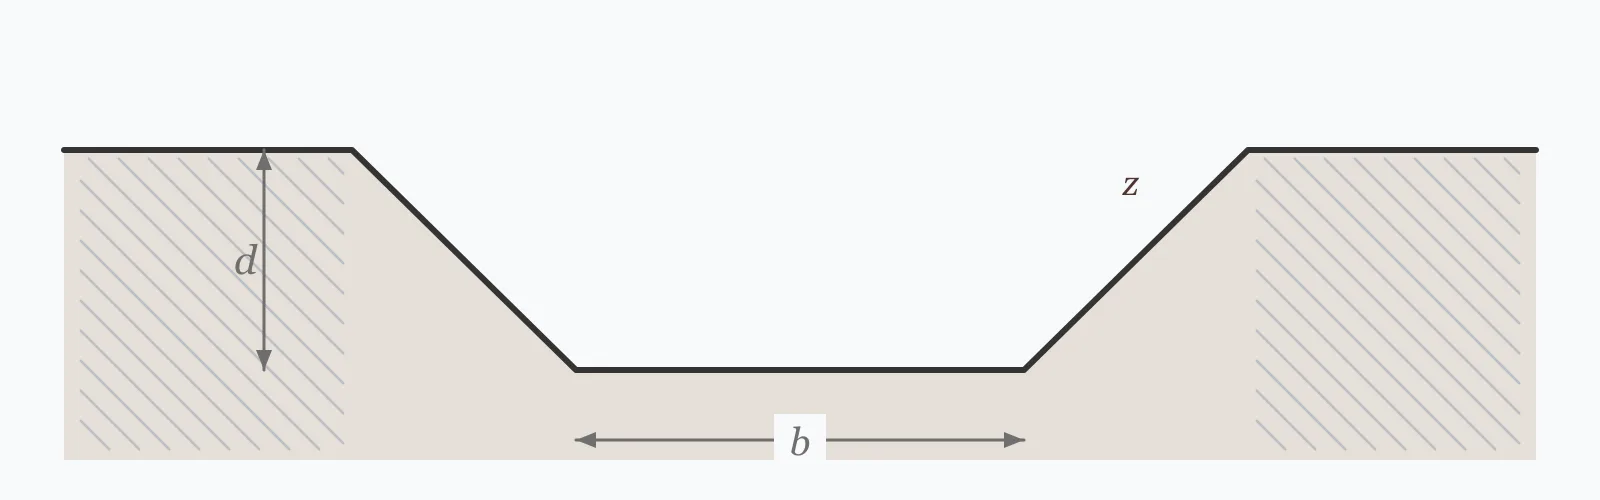
The average end area method takes two cross-sectional areas, averages them, and multiplies by the distance between them. Enter the cut and fill areas at each section along with the chainage interval to get the cut volume, the fill volume, the net balance, and the truck loads needed to move the surplus or shortfall.
Calculator
Units:
m²
Cross-sectional area of cut at the first section
m²
Cross-sectional area of cut at the second section
m²
Cross-sectional area of fill at the first section
m²
Cross-sectional area of fill at the second section
m
Chainage interval. 20 to 25 m is typical for road surveys
%
Bulking on excavation, applied to the haulage estimate. Sand 12%, clay 30%
Calculation Result
Press Calculate for the cut volume, the fill volume, the net balance, and the number of truck loads. A positive net means surplus material to export; a negative net means fill must be imported.
Step-by-Step Solution
Preliminary design aid. Results follow the published formulas cited
below and are intended for estimating, study and early design. Final design must be
verified by a licensed Professional Engineer against the code in force for your project.
Key Benefits
✓Applies the standard average end area method used across civil earthworks
✓Reports the net balance, which is what actually drives haulage cost
✓Converts the surplus or shortfall into truck loads at loose volume
✓Works for any pair of surveyed cross-sections
✓Sensitivity chart shows how the balance moves with chainage interval
✓Shareable links and CSV export for quantity records
What Is Cut & Fill?
A cross-section is a vertical slice through a site or road corridor, showing where the proposed surface sits above the existing ground (fill) and where it sits below (cut). The average end area method treats the volume between two adjacent sections as a prism: average the two end areas and multiply by the distance between them. Cut and fill are computed separately, because material cut from one part of a site is not automatically usable as fill elsewhere.
Why the net balance matters more than either volume
Cut re-used as fill on the same site is the cheapest material there is — it is already excavated and already on site. What costs money is the imbalance: surplus that must be hauled away and disposed of, or a deficit that must be filled with imported material. This is why grading design so often aims for a balanced site, and why the net figure, not the cut figure, is the one that appears in cost discussions.
The method's systematic bias
Averaging two end areas is exact only when the cross-section changes linearly between them. Where the areas differ greatly — at the transition from cut to fill, or where a section crosses a ridge — the true shape is closer to a pyramid than a prism, and averaging overestimates. The prismoidal formula, which weights a mid-section area at four sixths, corrects this. The error is negligible for similar areas and can exceed 10% where one area is several times the other, always in the direction of over-measurement.
Formula
V = ((A₁ + A₂) / 2) × L
Average end area method: mean of the two end areas times the distance between them
Related Formulas
V_net = V_cut − V_fill
V_loose = |V_net| × (1 + swell/100)
V_prismoidal = (L / 6) × (A₁ + 4A_m + A₂)
Variable Definitions
Symbol
Variable
Unit
Description
A₁, A₂
End Areas
m²
Cross-sectional area of cut or fill at each of the two sections.
L
Section Interval
m
Distance along the alignment between the two sections. Volume scales linearly with it.
V_cut
Cut Volume
m³
Bank volume of material to be excavated, measured in place.
V_fill
Fill Volume
m³
Compacted volume of material required to build the embankment.
V_net
Net Volume
m³
Cut minus fill. The imbalance that must be hauled on or off site.
A_m
Mid-Section Area
m²
Area at the midpoint, used by the prismoidal formula to correct curvature.
How to Use This Calculator
Take cut and fill areas separately at each sectionA single section can contain both, where the proposed surface crosses existing ground partway across the width. Enter each area on its own; do not net them at the section, because cut and fill are priced and handled differently.
Use the surveyed chainage intervalEnter the actual distance between the two sections. Volume scales linearly with it, so an error here transfers directly and proportionally into the quantity — a 10% error in interval is a 10% error in volume.
Repeat for each pair along the alignmentThis calculates one interval. For a full corridor, run each consecutive pair and sum the results — that summation is the standard way earthwork quantities are built up from a cross-section survey.
Set the swell factor for the materialThe truck count uses the swollen loose volume, because that is what a truck actually carries. Sand bulks about 12%, common earth 25%, clay 30% and rock 50% or more.
Read the net figure for costA positive net is surplus to export, a negative net is fill to import. Material moved within the site does not appear in this figure at all, which is a separate and much cheaper operation.
Worked Examples
Example 1
Two road cross-sections 50 m apart. Section 1 has 25 m² of cut and 10 m² of fill; section 2 has 35 m² of cut and 15 m² of fill. Common earth at 25% swell.
Fill volume: V = ((10 + 15) / 2) × 50 = 12.5 × 50 = 625 m³
Net volume: 1,500 − 625 = 875 m³ of surplus cut to export
Loose volume to haul: 875 × 1.25 = 1,093.75 m³
Truck loads at 12 m³ each: 1,093.75 / 12 = 91.1, so 92 loads
Interpretation: this interval generates 875 m³ more cut than it can absorb as fill. Whether that becomes a disposal cost depends on whether adjacent intervals along the alignment are in deficit and can take it.
Example 2
The same two sections surveyed at 20 m intervals instead of 50 m — the interval most road surveys actually use.
Every figure has fallen to exactly 40% of the 50 m case, matching the ratio 20/50 = 0.4. The relationship is strictly linear.
This is also why closer sections give better accuracy overall: the same total length is covered by more, shorter prisms, and each one has less opportunity for the true ground surface to depart from the linear interpolation the method assumes.
Closer sections cost more to survey, which is the trade-off. 20 to 25 m is the usual compromise on a road, tightening to 10 m or less through transitions where the section changes rapidly.
Section Interval Sensitivity
Every volume scales linearly with the distance between sections, so all three lines are straight through the origin. What this shows is how directly the surveyed interval drives the quantity — and therefore how much a mis-recorded chainage costs. The marker shows your current interval.
Net Volume (+ export / − import) vs Distance Between Sections
Recomputed live from your inputs. The marker shows your current value.
Line chart of Net Volume (+ export / − import) against Distance Between Sections. The same
values are listed in the data table below.
Values plotted above, sampled across the distance between sections range.
How to Interpret Your Results
The net volume tells you whether the site balances. A number close to zero means cut and fill offset each other and little material needs to move on or off site — the cheapest outcome by a wide margin.
Net Volume (+ export / − import): < -100Fill deficit — material must be imported
A net volume of your result m³ means fill exceeds cut, so material has to be imported. Imported fill carries purchase, haulage and testing costs, and it must satisfy the specification for engineered fill. Check whether adjacent intervals along the alignment have surplus cut that could supply it.
Net Volume (+ export / − import): -100 – 100Close to balanced
A net volume of your result m³ is close to balance across this interval, which is the cheapest outcome — material moves within the site rather than on or off it. Confirm the cut material is actually suitable as fill, since unsuitable cut has to be exported regardless of the balance.
Net Volume (+ export / − import): 100 – 2000Surplus cut to dispose of
A net volume of your result m³ is surplus material. Disposal is charged by volume and by haul distance, and it may attract landfill tax depending on the material. Check whether other intervals along the alignment are in deficit before assuming this leaves site.
Net Volume (+ export / − import): ≥ 2000Large surplus — review the design levels
A net volume of your result m³ is a substantial imbalance. Raising the proposed formation level reduces cut and increases fill simultaneously, so it moves the balance twice as fast as it might appear. It is usually worth testing a level adjustment before accepting the haulage cost.
Common Mistakes to Avoid
Netting cut against fill at the section
Why it matters:Entering a single net area per section loses the information that both operations exist. Cut and fill are separate activities with separate rates, and the cut material may not be suitable as fill at all.
✓How to avoid it:Enter cut and fill areas separately, as this calculator asks. Net them only at the volume stage, and only for the haulage question.
Ignoring the prismoidal correction where areas differ greatly
Why it matters:The average end area method assumes the section changes linearly between the two ends. Where one area is several times the other, the true solid is closer to a pyramid and averaging overestimates — by more than 10% in bad cases, always in the direction of over-measurement.
✓How to avoid it:Use closer sections through transitions, or apply the prismoidal formula (L/6)(A₁ + 4A_m + A₂). Watch particularly the interval where cut turns into fill, where one end area approaches zero.
Assuming cut volume equals fill volume when they match numerically
Why it matters:Cut is measured in bank volume, fill in compacted volume. Excavated soil bulks up when loosened and then compacts to a different density than it had in the ground — often to less volume than it originally occupied.
✓How to avoid it:Apply shrinkage when converting cut to compacted fill, typically 10 to 25% for common earth. A cut and fill that balance on paper may still leave a real shortfall.
Forgetting that not all cut is usable as fill
Why it matters:Topsoil, organic material, contaminated ground and soft clays are excavated as cut but cannot be placed as engineered fill. They must be exported and replaced with imported material, so a site that balances on volume may not balance on suitable material.
✓How to avoid it:Separate suitable from unsuitable cut in the take-off. The unsuitable fraction is exported and an equal volume of fill imported — a double cost that a simple balance calculation hides entirely.
Using bank volume for the truck count
Why it matters:Trucks carry loose material, which occupies more space than it did in the ground. Dividing bank volume by truck capacity understates the count by the full swell percentage — 25% for common earth.
✓How to avoid it:Apply the swell factor before dividing by capacity, as this calculator does. The example above needs 92 loads, not the 73 that bank volume alone would suggest.
Treating the interval balance as the site balance
Why it matters:One pair of sections is one slice of the works. A surplus here may be exactly what a deficit two hundred metres along needs, and moving it within the site is far cheaper than exporting and importing.
✓How to avoid it:Build a mass haul diagram across the whole alignment before deciding what leaves site. That is the analysis this calculation feeds into, not a substitute for it.
Practical Applications
▸Estimating earthwork quantities from surveyed cross-sections
▸Building up road corridor volumes interval by interval
▸Checking whether a site grading design balances
▸Estimating haulage and disposal for a bill of quantities
▸Comparing formation level options by their earthwork cost
▸Verifying a contractor's measured quantities
Industry Use Cases
Road construction
Cross-sections are taken at 20 to 25 m chainage intervals and volumes computed for each consecutive pair, then summed along the corridor. The interval tightens through transitions and vertical curves, where the section changes fastest and the linear assumption is weakest.
Site development
Formation levels are adjusted iteratively until cut and fill balance. Raising the level cuts less and fills more, so it shifts the balance from both directions at once — which is why a modest level change can eliminate a large haulage cost.
Quantity surveying
Earthwork is priced by volume and by haul distance, so the net figure and the mass haul diagram together determine the cost. Disputes commonly turn on whether the average end area method or the prismoidal formula was used through transitions.
Expert Tips
💡The net balance drives cost far more than either the cut or fill figure alone.
💡Volume scales linearly with the section interval — a 10% chainage error is a 10% volume error.
💡Average end area always overestimates where the two areas differ greatly.
💡Tighten section intervals through transitions, where cut turns into fill.
💡Trucks carry loose volume, so apply the swell factor before dividing by capacity.
💡Raising the formation level reduces cut and increases fill at the same time.
Advantages & Limitations
Advantages
✓Uses the standard method recognised across civil earthworks practice
✓Separates cut from fill, matching how the work is actually priced
✓Applies swell to the haulage estimate rather than reporting bank volume
✓Simple enough to verify by hand in a quantity dispute
✓Scales naturally to a full corridor by summing consecutive intervals
Limitations
!Handles one pair of sections; a full alignment requires summing each consecutive pair
!Average end area overestimates where the two end areas differ greatly
!Applies no prismoidal correction — use closer sections through transitions instead
!Assumes the ground surface varies linearly between sections
!Does not apply shrinkage when converting cut to compacted fill
!Does not distinguish suitable from unsuitable cut material
!Truck loads assume a 12 m³ capacity and that the full net volume is hauled off site
!Says nothing about haul distance, which is half the cost of earthmoving
How the Interval Drives Every Quantity
The same two cross-sections — 25 and 35 m² of cut, 10 and 15 m² of fill — computed at different chainage intervals, with 25% swell on the haulage. Every volume is directly proportional to the interval.
Cut areas 25 and 35 m², fill areas 10 and 15 m², swell 25%, truck capacity 12 m³ loose. Truck loads are rounded up, so they are not exactly proportional. A wider interval is not more material — it is the same site measured in coarser slices, with more room for the linear assumption to be wrong.
A volume calculation that averages the cross-sectional areas at two sections and multiplies by the distance between them: V = ((A₁ + A₂) / 2) × L. It is the standard method for earthwork quantities from a cross-section survey.
How accurate is the average end area method?
Exact when the section changes linearly between the two ends, and close enough for most work when the areas are similar. Where one area is several times the other, it overestimates — by more than 10% in bad cases, always in the direction of over-measurement.
What is the prismoidal formula?
V = (L/6)(A₁ + 4A_m + A₂), using the area at the midpoint as well as the two ends. It accounts for curvature between sections and is more accurate where the end areas differ greatly.
What does a balanced site mean?
That cut volume approximately equals fill volume, so material excavated in one place is placed in another without importing or exporting. It is by far the cheapest outcome, which is why formation levels are usually adjusted to achieve it.
Why doesn't cut volume equal the fill it produces?
Cut is measured in place as bank volume; fill is measured after compaction. Soil bulks when excavated and then compacts to a different density than it had in the ground, so a numerical balance between cut and fill volumes does not guarantee a material balance.
What is a swell factor?
The percentage by which soil expands when excavated and loosened. Sand bulks about 12%, common earth 25%, clay 30% and rock 50% or more. It matters for haulage, because a truck carries loose material.
What chainage interval should I use for cross-sections?
20 to 25 m is the usual compromise on a road, tightening to 10 m or less through transitions, vertical curves and anywhere the section changes rapidly. Closer sections are more accurate but cost more to survey.
How do I calculate the whole corridor rather than one interval?
Compute each consecutive pair of sections and sum the results. That summation is exactly how earthwork quantities are built up from a survey, and this calculator handles one pair of it.
What is a mass haul diagram?
A cumulative plot of net volume along the alignment. It shows where surplus material can economically be moved to a deficit, and where the haul distance makes exporting and importing cheaper instead.
Why is not all cut material usable as fill?
Topsoil, organic material, contaminated ground and soft clays are excavated but cannot be placed as engineered fill. They must be exported and replaced, so a site balancing on volume can still carry a double haulage cost.
Glossary
Cut
Material excavated because the proposed surface sits below existing ground.
Fill
Material placed and compacted because the proposed surface sits above existing ground.
Average end area method
Volume from the mean of two cross-sectional areas multiplied by the distance between them.
Prismoidal formula
A more accurate volume formula weighting the mid-section area at four sixths.
Bank volume
Volume of soil measured in place before excavation.
Loose volume
Volume after excavation, increased by the swell factor. What a truck carries.
Swell factor
The percentage increase in volume when soil is excavated and loosened.
Shrinkage
The reduction in volume when loose material is placed and compacted as fill.
Mass haul diagram
A cumulative plot of net earthwork volume along an alignment, used to plan material movement.
Chainage
Distance measured along an alignment, at which cross-sections are taken.
Scientific & Standards References
AASHTO — A Policy on Geometric Design of Highways and Streets — American Association of State Highway and Transportation Officials
CESMM4 — Civil Engineering Standard Method of Measurement, Class E: Earthworks — Institution of Civil Engineers
Manual of Contract Documents for Highway Works, Volume 1, Series 600 — Earthworks — National Highways
Kavanagh, B. F., Surveying with Construction Applications — Chapter on Volumes and Mass Haul — Pearson
Caterpillar Performance Handbook — Material Weights and Swell Factors — Caterpillar Inc.
Conclusion
The average end area method turns surveyed cross-sections into volumes by averaging two end areas and multiplying by the interval between them, and the linearity of that relationship is worth remembering: a chainage error transfers proportionally into the quantity. What matters commercially is not the cut or the fill but the difference between them, because material moved within a site is cheap and material crossing the site boundary is not. Two adjustments separate the arithmetic from the real quantity — swell, which is why the truck count in the example is 92 rather than 73, and suitability, since topsoil and soft material are cut that can never be fill. The method's one systematic bias is over-measurement where the two end areas differ greatly, which is exactly why sections are tightened through the transition from cut to fill.
Enter your own cross-section areas above and check the balance across the interval.