Compaction is specified as a percentage of the laboratory maximum dry density, but field tests measure wet density. Enter the measured wet density and moisture content along with the Proctor maximum and the required percentage to get dry density, relative compaction, a pass or fail verdict, and the density shortfall if any.
Calculator
Units:
kN/m³
Bulk density measured in the field, including water
%
Field moisture content of the same tested material
kN/m³
Laboratory Proctor maximum for this material
%
Specified minimum, commonly 90, 95 or 98%
Calculation Result
Press Calculate for the dry density, the relative compaction as a percentage of the Proctor maximum, the pass or fail verdict, and the density shortfall. A positive deficiency is how much dry density the fill is still missing.
Step-by-Step Solution
Preliminary design aid. Results follow the published formulas cited
below and are intended for estimating, study and early design. Final design must be
verified by a licensed Professional Engineer against the code in force for your project.
Key Benefits
✓Converts field wet density to dry density correctly
✓Compares against the Proctor maximum for a direct verdict
✓Reports the shortfall in kN/m³, not just a percentage
✓Handles any specified compaction level, not just 95%
✓Fast enough to check results at the test location
✓Shareable links and CSV export for test records
What Is Soil Compaction?
Compaction packs soil particles closer together by expelling air, raising the density and with it the strength, stiffness and resistance to future settlement. What matters structurally is the mass of solids per unit volume — the dry density — because water fills voids temporarily and will drain or evaporate. A specification of 95% compaction means the fill must achieve 95% of the maximum dry density that this same soil reaches in a standardised laboratory test.
Why the moisture correction matters
A field gauge or sand-cone test gives wet density, which includes the water. Dry density is γ_d = γ_w / (1 + w), where w is the moisture content as a decimal. At 12% moisture the divisor is 1.12, so the correction removes nearly 11% of the measured density. Getting the moisture content wrong by two percentage points shifts the reported relative compaction by roughly 1.7%, which is enough to flip a marginal result either way.
The Proctor curve and optimum moisture
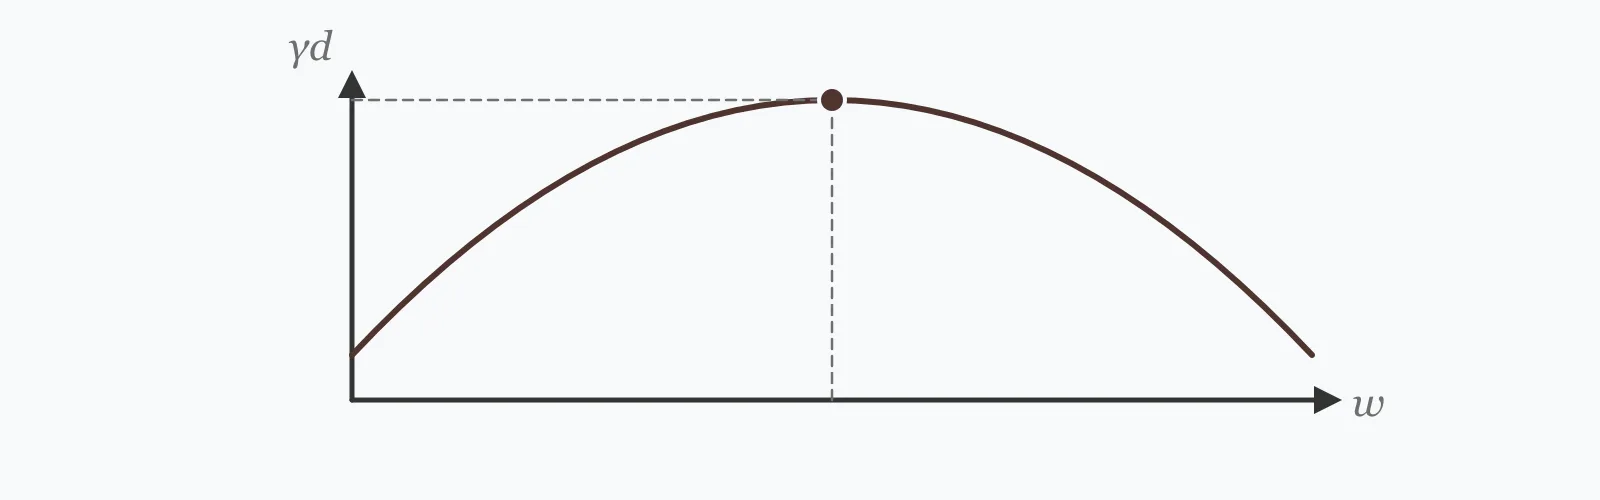
For a given compaction effort, dry density rises with moisture up to a peak and then falls. Below the optimum the soil is too stiff for particles to rearrange; above it, water occupies volume that solids cannot. That peak is the maximum dry density, and the moisture at which it occurs is the optimum moisture content. Compacting more than about two points either side of optimum wastes effort, which is why failing tests are so often a moisture problem rather than a rolling problem.
Formula
γ_d = γ_wet / (1 + w)
Dry density from measured wet density and moisture content w as a decimal
Related Formulas
RC = (γ_d / γ_d,max) × 100%
γ_d,required = (RC_required / 100) × γ_d,max
Deficiency = γ_d,required − γ_d
Variable Definitions
Symbol
Variable
Unit
Description
γ_wet
Wet Density
kN/m³
Bulk density measured in the field, including pore water.
w
Moisture Content
%
Mass of water as a percentage of the mass of dry solids.
γ_d
Dry Density
kN/m³
Density of solids alone. The quantity every specification is written in.
γ_d,max
Maximum Dry Density
kN/m³
Laboratory Proctor maximum for this specific material.
RC
Relative Compaction
%
Field dry density as a percentage of the laboratory maximum.
OMC
Optimum Moisture Content
%
The moisture at which the Proctor maximum occurs.
How to Use This Calculator
Use the moisture content of the tested materialThe moisture content must come from the same location and depth as the density measurement, not from an average across the lift or from an earlier test. A two-point error moves relative compaction by about 1.7 percentage points.
Use the Proctor result for this materialMaximum dry density is a property of the specific soil. If the fill has changed source, layer or grading, the earlier Proctor no longer applies — and a wrong maximum shifts every result on that fill by the same proportion.
Match the compaction effort to the specificationStandard and modified Proctor use different energy and give different maxima, with modified typically 5 to 10% higher. Enter the maximum from whichever test the specification names, or the verdict is against the wrong benchmark.
Enter the compaction level the specification requires95% is common for structural fill, 90% for landscaping and non-structural areas, and 98% or higher for pavement subgrade and base. Use the figure in the contract, not a default.
Read the deficiency, not just the verdictThe shortfall in kN/m³ says how far off the fill is. A small deficiency may respond to further rolling; a large one usually means the moisture is off optimum and the material needs drying or watering first.
Worked Examples
Example 1
A structural fill layer is tested with a nuclear gauge: wet density 20.5 kN/m³ at 12% moisture. The Proctor maximum for this material is 19.5 kN/m³ and the specification requires 95%.
Step-by-Step Solution
Convert moisture to a decimal: w = 12 / 100 = 0.12
The shortfall is small, about 1.2% of the target. Further passes with the roller would be the first thing to try, provided the moisture content is near optimum.
Example 2
The same layer after two further roller passes reaches a wet density of 21.5 kN/m³ at the same 12% moisture. Does it now pass?
Deficiency: 18.53 − 19.20 = −0.67 kN/m³ — negative, so the fill now exceeds requirement
Verdict: 98.4% comfortably exceeds 95% — PASS
A 4.9% rise in wet density produced a 4.9% rise in relative compaction, from 93.9 to 98.4. The relationship is exactly proportional, which makes it easy to judge how much more density a failing test needs.
That proportionality cuts both ways: a 5% error in the field measurement itself moves the reported result by 5%, so the measurement deserves the same scrutiny as the verdict.
Wet Density Sensitivity
How relative compaction responds to the measured wet density, holding moisture content constant. The relationship is linear, so a 5% error in the field measurement moves the verdict by 5 percentage points. The marker shows your current value.
Relative Compaction vs Field Wet Density
Recomputed live from your inputs. The marker shows your current value.
Line chart of Relative Compaction against Field Wet Density. The same
values are listed in the data table below.
Values plotted above, sampled across the field wet density range.
How to Interpret Your Results
Relative compaction is compared against the specified minimum. What matters as much as the pass or fail is the size of the gap, because it distinguishes a layer that needs more rolling from one whose moisture content is wrong.
Relative Compaction: < 85Severely under-compacted
Relative compaction of your result% is far below any normal requirement. This is not usually a rolling problem — check that the Proctor maximum belongs to this material, and that the moisture content is not well off optimum. Rolling wet or dry soil expends effort without gaining density.
Relative compaction of your result% falls short of the 90% usually required even for non-structural fill. Verify the moisture content is within about two points of optimum before adding passes, since compacting off-optimum soil gains little.
Relative Compaction: 90 – 95Meets 90% but not 95%
Relative compaction of your result% is adequate for landscaping and non-structural fill but short of the 95% normally specified for structural fill. Read the deficiency figure to judge how much further compaction is needed.
Relative Compaction: 95 – 100Meets structural fill requirement
Relative compaction of your result% satisfies the usual 95% requirement for structural fill. Pavement subgrade and base courses often demand 98% or more, so check the figure the specification actually names.
Relative Compaction: ≥ 100Exceeds the laboratory maximum
Relative compaction of your result% exceeds 100% of the Proctor maximum. This is possible where field effort exceeds laboratory effort, but it more often signals that the Proctor result belongs to a different material, or that the moisture content used in the conversion is wrong. Verify both before accepting it.
Common Mistakes to Avoid
Comparing wet density against the Proctor maximum
Why it matters:The Proctor maximum is a dry density. Comparing a wet density against it overstates compaction by the full moisture percentage — at 12% moisture, by about 12%, which passes almost anything.
✓How to avoid it:Always divide by (1 + w) first. This calculator does it automatically, but the error is common in spreadsheets built on site.
Using a moisture content from a different sample
Why it matters:Moisture varies across a fill and with depth, and the conversion is only as good as the moisture figure fed into it. A two-point error moves relative compaction by roughly 1.7 percentage points.
✓How to avoid it:Take the moisture measurement at the same point as the density test. Where a nuclear gauge is used, confirm its moisture reading against an oven-dried sample periodically — gauges are calibrated for particular soil chemistry and drift on unusual materials.
Applying an old Proctor to changed material
Why it matters:Maximum dry density is a property of the specific soil. A change of borrow pit, a different layer or a change in grading gives a different maximum, and every result on that fill is then measured against the wrong benchmark.
✓How to avoid it:Run a new Proctor whenever the material source or appearance changes. A one-point Proctor check is quick and catches most substitutions.
Confusing standard and modified Proctor
Why it matters:Modified Proctor uses about 4.5 times the compaction energy and yields a maximum typically 5 to 10% higher. Testing against the standard maximum when the specification names modified overstates compaction by that margin.
✓How to avoid it:Confirm which test the specification requires and use that maximum. 95% of modified is a substantially harder target than 95% of standard.
Adding roller passes when the moisture is wrong
Why it matters:Dry density peaks at the optimum moisture content. More than about two points either side, additional passes produce very little gain, and on wet cohesive soil they can pump the layer and damage the structure already achieved.
✓How to avoid it:Check moisture against optimum first. Too wet means aerating or drying; too dry means watering and mixing. Only then add passes.
Testing a lift that is too thick
Why it matters:Compaction energy attenuates with depth. A layer thicker than the roller can influence — commonly 200 to 300 mm compacted for most plant — will be dense at the top and loose at the bottom, and a surface test will not detect it.
✓How to avoid it:Keep lifts within the thickness the specified plant can compact, and test at depth periodically rather than only at the surface.
Practical Applications
▸Verifying compaction of structural fill and backfill
▸Checking pavement subgrade and base course density
▸Assessing trench backfill before reinstatement
▸Converting field density test results for records
▸Judging how much further compaction a failing layer needs
▸Auditing earthworks quality control data
Industry Use Cases
Earthworks quality control
Field density tests are taken at a specified frequency per volume or per area of each lift, and each measurement must be converted before it can be judged. Testing at the point of measurement lets a marginal result be re-rolled while the plant is still there.
Highway construction
Pavement layers carry the highest requirements — often 98% or more of modified Proctor — because subgrade settlement under a bound surface is expensive to correct. The margin between 95 and 98% is where most rework arises.
Utility reinstatement
Trench backfill is compacted in thin lifts because trench walls restrict roller access and plate compactors influence far less depth. Poorly compacted trenches are the source of most localised road settlement.
Expert Tips
💡Dry density is what every specification means, even when the test reports wet density.
💡A two-point moisture error moves relative compaction by about 1.7 percentage points.
💡Check moisture against optimum before adding passes — off-optimum rolling gains little.
💡A result above 100% usually means the wrong Proctor, not exceptional compaction.
💡Modified Proctor maxima run 5 to 10% above standard; confirm which the spec names.
💡Relative compaction is exactly proportional to wet density, so the arithmetic scales directly.
Advantages & Limitations
Advantages
✓Removes the most common arithmetic error in field compaction control
✓Reports the shortfall in density units, which scales directly to remedial effort
✓Works with any specified compaction level and either Proctor standard
✓Fast enough to use at the test location while plant is still on site
✓Simple enough to check by hand during an audit
Limitations
!Only as accurate as the moisture content and Proctor maximum supplied
!Does not model the Proctor curve, so it cannot say whether moisture is near optimum
!Varying moisture content while holding wet density fixed is arithmetic, not a physical experiment — in the field the two change together
!Assumes the Proctor maximum belongs to the material actually tested
!Gives no indication of compaction uniformity with depth within a lift
!Does not distinguish standard from modified Proctor — the user must supply the right maximum
!Says nothing about the soil's suitability as fill, only its density
Field Results Against a 95% Specification
The same material with a Proctor maximum of 19.5 kN/m³ and a 95% requirement. The first three rows vary the measured density at constant moisture; the last two keep the density and change only the moisture figure used in the conversion.
Proctor maximum 19.5 kN/m³, requirement 95% (18.53 kN/m³). The last two rows share an identical field density yet land on opposite sides of the specification purely on the moisture value used — which is why that measurement deserves as much care as the density itself.
Divide by (1 + w), where w is the moisture content as a decimal. A wet density of 20.5 kN/m³ at 12% moisture gives 20.5 / 1.12 = 18.30 kN/m³.
What does 95% compaction mean?
That the field dry density must reach at least 95% of the maximum dry density this same soil achieves in a standardised laboratory Proctor test. It is always a dry density comparison.
What is relative compaction?
Field dry density expressed as a percentage of the laboratory maximum dry density. It is the number every compaction specification is written against.
Why does moisture content matter so much?
For two reasons. It enters the conversion from wet to dry density directly, so an error propagates straight into the verdict — and physically, dry density peaks at an optimum moisture, so compacting off-optimum soil gains very little for the effort.
What is optimum moisture content?
The moisture at which a given compaction effort produces the maximum dry density. Below it the soil resists rearrangement; above it, water occupies volume that solids cannot.
Can relative compaction exceed 100%?
Yes, where field effort exceeds the laboratory effort — but it more often means the Proctor result belongs to a different material or the moisture figure is wrong. Verify both before accepting a result above 100%.
What is the difference between standard and modified Proctor?
Modified Proctor applies about 4.5 times the compaction energy and produces a maximum dry density typically 5 to 10% higher. 95% of modified is a considerably harder target than 95% of standard.
What compaction is required for structural fill?
95% is the common requirement for structural fill, 90% for landscaping and non-structural areas, and 98% or higher for pavement subgrade and base courses. Use the figure in the contract.
My test failed by a small margin — what should I do?
Check the moisture content against optimum first. If it is within about two points, further roller passes will usually close a small deficiency. If it is well off, the layer needs drying or watering before more compaction will achieve anything.
How thick should a compacted lift be?
Typically 200 to 300 mm compacted for most rollers, less for plate compactors in trenches. Compaction energy attenuates with depth, so a layer thicker than the plant can influence will be dense at the top and loose at the bottom — and a surface test will not reveal it.
Glossary
Dry density
Mass of soil solids per unit total volume, excluding pore water. The quantity specifications are written in.
Wet density
Bulk density including pore water, which is what field tests measure directly.
Relative compaction
Field dry density as a percentage of the laboratory maximum dry density.
Proctor test
A standardised laboratory compaction test that establishes maximum dry density and optimum moisture content.
Optimum moisture content
The moisture content at which a given compaction effort yields the maximum dry density.
Modified Proctor
A higher-energy version of the Proctor test, giving a maximum typically 5 to 10% above the standard test.
Lift
A single layer of fill placed and compacted before the next is added.
Nuclear density gauge
A field instrument measuring density and moisture by radiation attenuation, requiring periodic checks against oven-dried samples.
Sand cone test
A field density method using calibrated sand to measure the volume of an excavated hole.
Structural fill
Engineered fill supporting structures or pavements, typically requiring 95% compaction or more.
Scientific & Standards References
ASTM D698 — Standard Test Methods for Laboratory Compaction Characteristics of Soil Using Standard Effort — ASTM International
ASTM D1557 — Laboratory Compaction Characteristics of Soil Using Modified Effort — ASTM International
ASTM D6938 — In-Place Density and Water Content of Soil by Nuclear Methods — ASTM International
BS 1377-4 — Methods of test for soils for civil engineering purposes: Compaction-related tests — British Standards Institution
Proctor, R. R., Fundamental Principles of Soil Compaction, Engineering News-Record (1933) — Engineering News-Record
Conclusion
Compaction control is a conversion followed by a comparison, and each half has a characteristic failure mode. The conversion divides measured wet density by (1 + w), so the moisture figure deserves as much care as the density measurement — the comparison table above shows one field density landing on either side of the specification purely on which moisture value was used. The comparison is against a Proctor maximum belonging to one specific material at one specific compaction effort, so a changed borrow pit or a standard-versus-modified mix-up invalidates every result on the fill. Where a test does fail, the deficiency in kN/m³ says how far off it is, and the moisture content says whether more rolling will help.
Enter your own field test above and see where it lands against the specification.