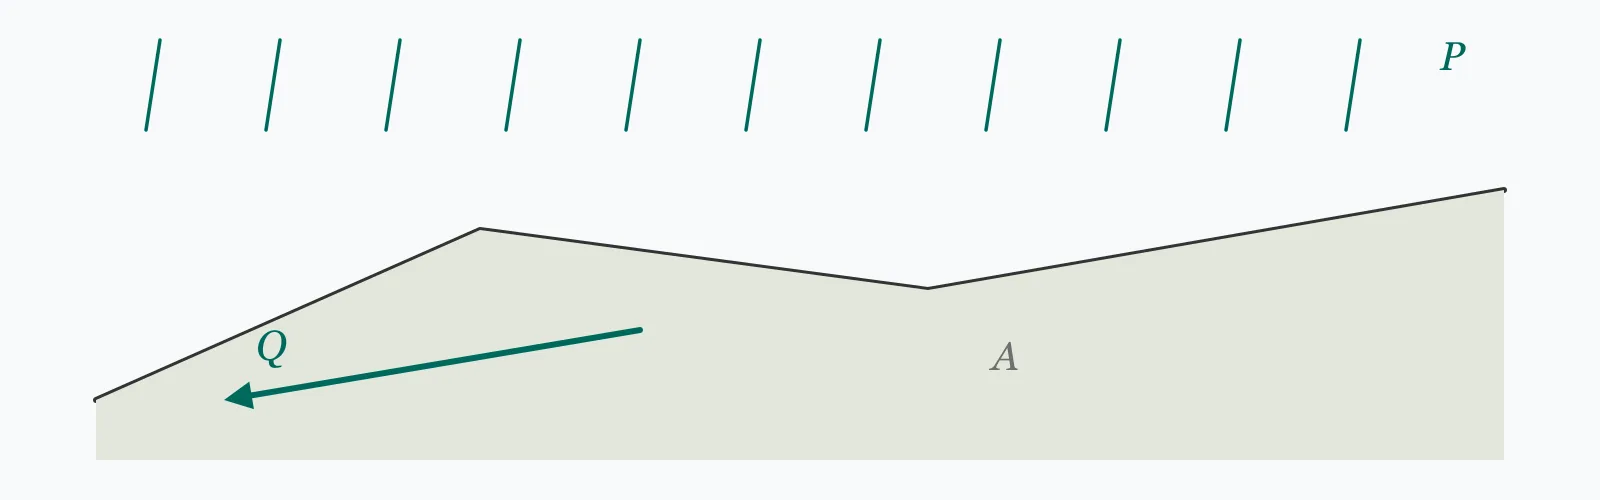
The SCS Curve Number method converts a storm rainfall depth into a runoff depth using a single parameter that describes the catchment: Q = (P − 0.2S)²/(P + 0.8S). Enter the rainfall, the curve number and the catchment area to get the runoff depth, the runoff volume, the potential maximum retention, and the fraction of rainfall that becomes runoff.
Press Calculate for the runoff depth in millimetres, the total runoff volume for the catchment area, the potential maximum retention S, and the proportion of the rainfall that becomes runoff. This gives volume, not peak flow rate.
Step-by-Step Solution
Preliminary design aid. Results follow the published formulas cited
below and are intended for estimating, study and early design. Final design must be
verified by a licensed Professional Engineer against the code in force for your project.
Key Benefits
✓Applies the standard SCS Curve Number method used worldwide
✓Captures the non-linear relationship between storm size and runoff fraction
✓Reports the runoff ratio, which makes the non-linearity visible
✓Converts directly to a volume for the catchment area entered
✓Sensitivity chart shows how the runoff fraction grows with storm size
✓Shareable links and CSV export for design records
What Is Catchment Runoff?
The Curve Number method estimates how much of a storm's rainfall becomes direct runoff. A single dimensionless number between about 30 and 98 describes the catchment's combined soil type, land cover and antecedent condition. From it comes S, the potential maximum retention — how much water the catchment could absorb — and from S comes the runoff. A curve number of 30 describes deep sandy soil under woodland; 98 describes paved surface and open water.
Initial abstraction
Before any runoff begins, rainfall is intercepted by vegetation, fills surface depressions and wets the ground. That quantity is the initial abstraction Ia, taken conventionally as 0.2S. At a curve number of 75, S is 84.7 mm and Ia is 16.9 mm — so storms smaller than about 17 mm produce no runoff at all in this model. The threshold is sharp, which means the method behaves poorly for small events.
Why the runoff fraction is not constant
As a storm continues, the catchment's remaining capacity to absorb water falls, so a larger share of each additional millimetre runs off. At a curve number of 75, a 25 mm storm yields 2.8% runoff, a 75 mm storm 31.5% and a 150 mm storm 54.2%. This is the method's central insight, and it is why a fixed runoff coefficient — as used in the Rational Method — cannot be right across a range of return periods.
Formula
Q = (P − Ia)² / (P − Ia + S)
SCS runoff depth, valid when P exceeds the initial abstraction Ia; otherwise Q = 0
Related Formulas
S = 25400 / CN − 254
Ia = 0.2 · S
Q = (P − 0.2S)² / (P + 0.8S)
V = (Q / 1000) · A · 10000
Variable Definitions
Symbol
Variable
Unit
Description
P
Rainfall Depth
mm
Total storm rainfall, conventionally a 24-hour total.
CN
Curve Number
—
Catchment descriptor from 30 to 98, combining soil, cover and antecedent condition.
S
Potential Retention
mm
Maximum depth the catchment could absorb after runoff begins.
Ia
Initial Abstraction
mm
Rainfall lost to interception, depression storage and wetting before runoff starts.
Q
Runoff Depth
mm
Depth of direct runoff generated by the storm.
A
Catchment Area
ha
Area contributing runoff to the point of interest.
How to Use This Calculator
Use a storm total, not an intensityThe Curve Number method works on rainfall depth, conventionally a 24-hour total, not on a rate in mm per hour. It was calibrated on daily storm data, which is also why it is least reliable for short, intense events.
Select the curve number from soil and cover togetherCurve numbers are tabulated by hydrologic soil group (A well-drained sand through D heavy clay) crossed with land cover and condition. The same land use on group A and group D soils can differ by 20 points or more, which is a large difference in runoff.
Use an area-weighted curve number for mixed catchmentsWhere a catchment has several land uses, weight the curve numbers by area. Note this is an approximation — the relationship is non-linear, so a weighted CN is not quite the same as summing the runoff from each sub-area computed separately.
Consider the antecedent conditionTabulated curve numbers assume average antecedent moisture. Wet antecedent conditions raise the effective CN substantially, which matters because large design storms often follow prolonged rain. Design guidance usually specifies which condition to use.
Remember this gives volume, not peak flowThe result is a runoff depth and volume. Converting to a peak discharge requires a unit hydrograph and the catchment's time of concentration. For a peak flow directly, the Rational Method is the usual tool on small catchments.
Worked Examples
Example 1
A 10 hectare rural catchment with a curve number of 75 receives a 75 mm design storm. Find the runoff depth and volume.
Step-by-Step Solution
Potential retention: S = 25400/CN − 254 = 25400/75 − 254 = 338.67 − 254 = 84.67 mm
Initial abstraction: Ia = 0.2 × 84.67 = 16.93 mm
Effective rainfall: P − Ia = 75 − 16.93 = 58.07 mm
Runoff ratio: 23.62 / 75 = 31.5% of the rainfall becomes runoff
Interpretation: about two thirds of the storm is absorbed. Note that the first 16.93 mm produces nothing at all — a storm of 17 mm or less would generate no runoff in this model.
Example 2
The same catchment after development, with the curve number rising from 75 to 85 — roughly the shift from mixed rural land to suburban residential.
Step-by-Step Solution
Potential retention: S = 25400/85 − 254 = 298.82 − 254 = 44.82 mm, down from 84.67 mm
Initial abstraction: Ia = 0.2 × 44.82 = 8.96 mm, roughly half what it was
A 13.3% increase in curve number has produced a 66.5% increase in runoff volume. That disproportion is the whole argument for attenuation storage on development sites.
The extra 1,572 m³ has to go somewhere. Attenuating it back to the pre-development discharge rate is what a storage tank with a flow control orifice does, and this volume is where its sizing starts.
Note also that the threshold has moved: storms above about 9 mm now generate runoff, where previously it took 17 mm. Small, frequent events that used to soak away now reach the drainage system.
Storm Size Sensitivity
Runoff stays at zero until the rainfall exceeds the initial abstraction, then rises with increasing steepness. Switch to the runoff ratio to see the fraction climbing with storm size — the method's central point, and the reason a fixed runoff coefficient cannot hold across return periods. The marker shows your current rainfall.
Runoff Depth vs Storm Rainfall (P)
Recomputed live from your inputs. The marker shows your current value.
Line chart of Runoff Depth against Storm Rainfall (P). The same
values are listed in the data table below.
Values plotted above, sampled across the storm rainfall (p) range.
How to Interpret Your Results
The runoff ratio is the most informative output, because it shows how the catchment is behaving for this particular storm rather than in general. It rises with storm size, which is exactly what a fixed coefficient cannot represent.
Runoff as % of Rainfall: < 10Most of the storm is absorbed
Only your result% of the rainfall becomes runoff, so the catchment is absorbing nearly all of it. This is typical of permeable soils, good vegetation cover, or a storm not much larger than the initial abstraction. Bear in mind the method is least reliable at this end of its range.
Runoff as % of Rainfall: 10 – 35Moderate runoff response
your result% of the rainfall becomes runoff, a typical rural or lightly developed response. Remember this fraction is specific to this storm size — a larger event on the same catchment will produce a higher proportion, not just a higher total.
Runoff as % of Rainfall: 35 – 60High runoff response
your result% of the rainfall becomes runoff, which indicates substantial impervious area, heavy soils or a large storm. Downstream conveyance and attenuation should be checked against this volume rather than against a general assumption.
Runoff as % of Rainfall: ≥ 60Catchment behaving as near-impervious
your result% of the rainfall becomes runoff, so the catchment is absorbing very little. Verify the curve number is correct for the conditions, then treat the resulting volume as effectively the whole storm for design purposes.
Runoff Depth: < 0.01No runoff generated
The rainfall does not exceed the initial abstraction, so this model produces no runoff at all. The threshold is sharp and somewhat artificial — a storm slightly larger will produce a disproportionate jump, so do not read this as a guarantee that nothing runs off.
Common Mistakes to Avoid
Using the same curve number regardless of soil group
Why it matters:Curve numbers are tabulated by land cover crossed with hydrologic soil group. The same pasture can be CN 39 on well-drained sand and CN 80 on heavy clay — a difference that changes the runoff by several times.
✓How to avoid it:Identify the soil group from a soil survey or infiltration testing, then read the curve number for that group and cover. The soil group is often the larger of the two influences.
Treating the runoff ratio as a fixed catchment property
Why it matters:The fraction of rainfall that runs off rises with storm size — from 2.8% at 25 mm to 54.2% at 150 mm on a CN 75 catchment. A coefficient derived from one event does not transfer to another return period.
✓How to avoid it:Recompute for each design storm. This non-linearity is the main advantage the Curve Number method has over a fixed runoff coefficient.
Applying the method to short, intense storms
Why it matters:It was calibrated on 24-hour rainfall totals. For a 15-minute summer downpour, the initial abstraction assumption and the storm-total basis both misrepresent what happens.
✓How to avoid it:Use it for daily-scale design storms. For short-duration urban drainage design, the Rational Method or a full rainfall-runoff model is more appropriate.
Area-weighting curve numbers without checking
Why it matters:The runoff equation is non-linear, so the runoff from an area-weighted curve number is not the same as the sum of runoffs computed separately for each sub-area. The difference grows as the sub-catchments become more dissimilar.
✓How to avoid it:For a catchment with strongly contrasting land uses — a large impervious area within permeable ground, say — compute each part separately and add the volumes.
Ignoring antecedent moisture
Why it matters:Tabulated curve numbers assume average antecedent conditions. A catchment already saturated by preceding rain behaves with a much higher effective curve number, and design storms frequently arrive on wet ground.
✓How to avoid it:Check which antecedent condition the applicable design guidance specifies, and use the wet-condition curve number where a critical event is likely to follow prolonged rainfall.
Reading the volume as a peak flow
Why it matters:The output is a depth and a volume over the whole storm. Peak discharge depends on how quickly that volume arrives, which is a function of catchment shape, slope and time of concentration — none of which appear in this calculation.
✓How to avoid it:Convert with a unit hydrograph, or use the Rational Method where a peak rate is what is needed. Volume sizes storage; peak rate sizes pipes.
Practical Applications
▸Estimating storm runoff volume for attenuation storage sizing
▸Quantifying the hydrological effect of a proposed development
▸Comparing pre- and post-development runoff for a planning submission
▸Screening flood volumes for small and medium catchments
▸Assessing land use change effects on a watercourse
▸Providing input volumes for a unit hydrograph analysis
Industry Use Cases
Development drainage
Pre- and post-development runoff volumes are computed for the same design storm, and the difference sets the attenuation storage required. Because the relationship is non-linear, a modest rise in curve number produces a disproportionate volume increase — which is what makes the storage requirement so large on greenfield sites.
Flood risk assessment
Runoff volumes are computed across a range of return periods, and the growing runoff fraction with storm size is central to the result. A catchment that behaves benignly in frequent events can behave close to impervious in an extreme one.
Agricultural and land management
Changes in cropping, cultivation and drainage alter the curve number, and the method quantifies the downstream consequence. It is widely used to compare land management options because a single parameter captures the change.
Expert Tips
💡The runoff fraction rises with storm size — it is not a catchment constant.
💡Storms below the initial abstraction, 0.2S, produce no runoff in this model.
💡Soil group often matters more than land cover: the same pasture spans CN 39 to 80.
💡A 13% rise in curve number produced a 66% rise in runoff volume in the example above.
💡Area-weighting curve numbers is an approximation, because the equation is non-linear.
💡This gives volume, which sizes storage. Peak rate, which sizes pipes, needs more.
Advantages & Limitations
Advantages
✓Captures the non-linear relationship between storm size and runoff fraction
✓Needs only one catchment parameter, extensively tabulated and widely understood
✓Well documented and accepted by regulators in many jurisdictions
✓Applies across a wide range of catchment sizes and land uses
✓Simple enough to verify by hand during a review
Limitations
!Empirical throughout — the curve number has no direct physical measurement
!Calibrated on 24-hour storm totals; unreliable for short, intense events
!The 0.2S initial abstraction is a convention, and research supports lower values
!Produces a sharp zero-runoff threshold that does not exist in reality
!Gives runoff volume, not peak discharge or a hydrograph shape
!Area-weighted curve numbers are approximate for mixed catchments
!Takes no account of storm pattern, catchment slope or time of concentration
The Same 75 mm Storm on Different Catchments
A 10 hectare catchment receiving 75 mm of rainfall, with the curve number varied across its practical range. The runoff volume grows far faster than the curve number does.
10 ha catchment, 75 mm storm. The curve number rises by 73% down the table while the runoff volume rises by a factor of 13. The step most relevant to development — 75 to 85 — is a 13% change in CN and a 67% change in volume.
An empirical method that converts storm rainfall depth into runoff depth using a single catchment parameter, the curve number, which combines soil type, land cover and antecedent condition.
How do I calculate runoff with the curve number method?
Find S = 25400/CN − 254 in millimetres, then Q = (P − 0.2S)²/(P + 0.8S). A 75 mm storm on a CN 75 catchment gives 23.62 mm of runoff.
What curve number should I use?
It depends on soil group and land cover together. Roughly: 30 to 55 for woodland on permeable soil, 65 to 75 for pasture and mixed rural, 80 to 90 for suburban development, and 95 to 98 for dense urban and paved surfaces.
What is initial abstraction?
The rainfall absorbed by interception, surface depressions and wetting before runoff begins, taken conventionally as 0.2S. At CN 75 that is 16.9 mm, so storms smaller than that produce no runoff in the model.
What is potential maximum retention?
S, the depth of water the catchment could still absorb once runoff has begun. It falls sharply as the curve number rises — from 207.8 mm at CN 55 to 13.4 mm at CN 95.
Why does the runoff percentage change with storm size?
Because the catchment's remaining absorption capacity falls as the storm continues, so a larger share of each additional millimetre runs off. At CN 75 the fraction rises from 2.8% at 25 mm to 54.2% at 150 mm.
How much does development increase runoff?
More than the curve number change suggests. Raising CN from 75 to 85 — a 13% increase — raised runoff volume by 67% in the example above, which is why attenuation storage requirements are so substantial.
Can I average curve numbers across a catchment?
Area-weighting is standard practice but approximate, because the runoff equation is non-linear. Where sub-catchments differ strongly, compute each separately and add the volumes.
Does this give me a peak flow rate?
No — it gives runoff depth and volume. Peak discharge requires a unit hydrograph and the catchment time of concentration, or a different method such as the Rational Method for small catchments.
How does the curve number method compare with the Rational Method?
The Rational Method gives a peak flow rate directly from a fixed runoff coefficient and a rainfall intensity, which suits small catchments and pipe sizing. The Curve Number method gives a volume and captures the non-linear response, which suits storage sizing and larger catchments.
Glossary
Curve number
A dimensionless catchment descriptor from 30 to 98 combining soil, cover and antecedent condition.
Potential maximum retention
S, the depth of water a catchment can still absorb once runoff has begun.
Initial abstraction
Rainfall lost to interception, depression storage and wetting before runoff starts; conventionally 0.2S.
Runoff depth
The depth of direct runoff generated by a storm, in millimetres over the catchment.
Hydrologic soil group
A to D classification by infiltration capacity, A being well-drained sand and D heavy clay.
Antecedent moisture
How wet the catchment was before the storm, which strongly affects the effective curve number.
Direct runoff
The portion of rainfall reaching the watercourse quickly by surface and near-surface routes.
Time of concentration
The time for runoff to travel from the hydraulically most distant point to the outlet.
Unit hydrograph
The runoff response to a unit depth of effective rainfall, used to convert volume into a peak flow.
Attenuation storage
Volume provided to hold runoff and release it at a controlled rate.
Scientific & Standards References
USDA NRCS National Engineering Handbook, Part 630 — Hydrology, Chapter 10: Estimation of Direct Runoff from Storm Rainfall — US Department of Agriculture
USDA TR-55 — Urban Hydrology for Small Watersheds — US Department of Agriculture
Mishra, S. K. and Singh, V. P., Soil Conservation Service Curve Number (SCS-CN) Methodology — Springer
CIRIA C753 — The SuDS Manual, Chapter on Hydrology and Runoff Estimation — Construction Industry Research and Information Association
Hawkins, R. H. et al., Curve Number Hydrology: State of the Practice — American Society of Civil Engineers
Conclusion
The Curve Number method exists because the fraction of a storm that runs off is not a property of the catchment alone — it is a property of the catchment and the storm together. On a CN 75 catchment that fraction climbs from 2.8% in a 25 mm event to 54.2% in a 150 mm one, which is precisely what a fixed runoff coefficient cannot represent. The consequence for development work is the disproportion shown in the table above: raising the curve number from 75 to 85 is a 13% change in the parameter and a 67% change in the runoff volume, and that extra volume is where attenuation storage sizing begins. Two caveats matter. The method was calibrated on 24-hour storm totals and is unreliable for short intense events. And what it produces is a volume — which sizes storage — not a peak rate, which sizes pipes.
Enter your own storm, curve number and catchment area above to estimate runoff volume.