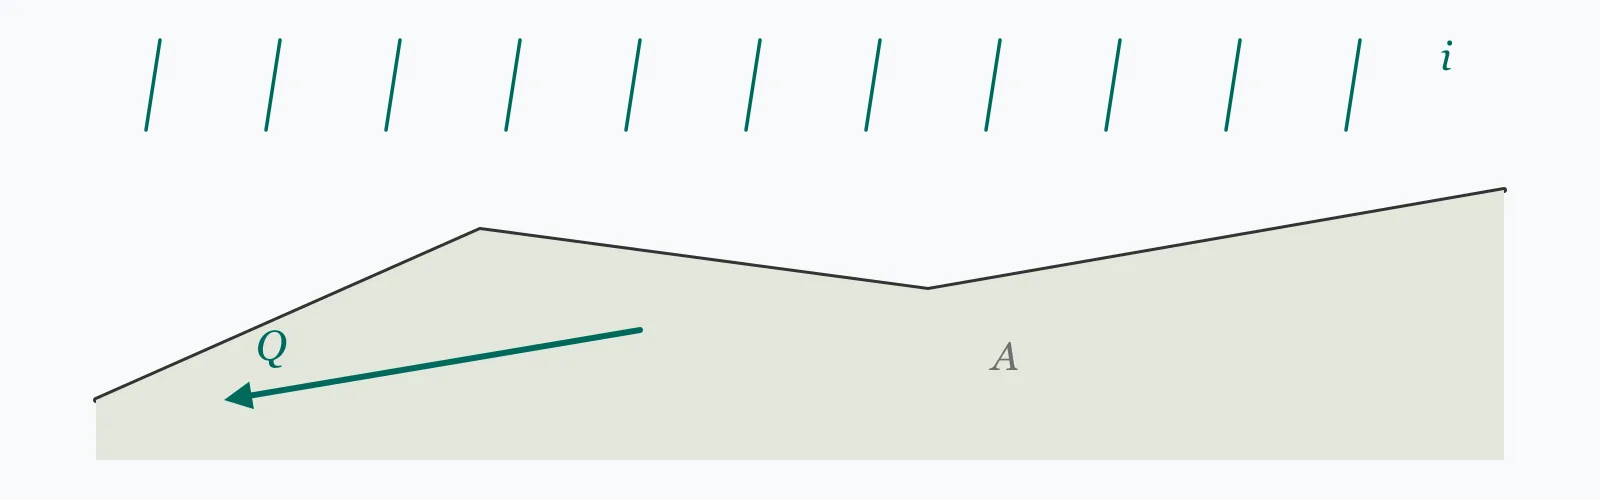
The Rational Method gives peak runoff as Q = CiA/360, with C the runoff coefficient, i the rainfall intensity in mm/hr and A the catchment area in hectares. Enter all three to get the peak flow in m³/s and L/s, plus the hourly rainfall and runoff volumes. It is the standard method for small urban catchments.
From the local intensity-duration-frequency data for your return period
hectares
Contributing area. Method validity drops above about 50–80 ha
Calculation Result
Press Calculate for the peak runoff in cubic metres and litres per second, and the rainfall and runoff volumes over one hour. The peak flow is what sizes a pipe; the volume is what sizes a storage tank.
Step-by-Step Solution
Preliminary design aid. Results follow the published formulas cited
below and are intended for estimating, study and early design. Final design must be
verified by a licensed Professional Engineer against the code in force for your project.
Key Benefits
✓Applies the Rational Method in its standard metric form
✓Returns both peak flow and hourly volume, which size different things
✓Includes runoff coefficients for the common surface types
✓States the catchment size limit beyond which the method stops applying
✓Sensitivity chart shows the linear response to rainfall intensity
✓Shareable links and CSV export for drainage design records
What Is Rainfall-Runoff?
The Rational Method states that peak runoff equals the rainfall intensity multiplied by the catchment area and a coefficient representing how much of the rain runs off rather than infiltrating or evaporating. In metric form with intensity in mm/hr and area in hectares, the constant 360 converts the result to cubic metres per second. The logic is that if rain falls long enough for the whole catchment to be contributing simultaneously, the outflow reaches a steady peak.
The runoff coefficient
C ranges from about 0.05 for flat woodland to 0.95 for asphalt and roofs. It bundles together infiltration, depression storage, evaporation and interception into a single number, which is a considerable simplification — the same surface behaves differently when saturated than when dry. For a mixed catchment, C is normally area-weighted across the surface types present, and urbanisation raises it dramatically: replacing grassland with pavement can triple the peak flow from the same rainfall.
Time of concentration and why size matters
The method assumes the storm lasts at least as long as the time of concentration — the time for water to travel from the most remote point of the catchment to the outlet. Only then does the whole area contribute at once. On a small urban catchment that time is minutes and the assumption holds. On a large or long catchment it can be hours, over which real rainfall is neither uniform nor constant, and the method progressively overestimates. That is why its use is generally capped around 50 to 80 hectares.
Formula
Q = C · i · A / 360
Rational Method peak runoff in m³/s, with i in mm/hr and A in hectares
Related Formulas
Q = C · i · A
V_rain = (i/1000) · A · 10,000
V_runoff = C · V_rain
C_weighted = Σ(C_j · A_j) / ΣA_j
Variable Definitions
Symbol
Variable
Unit
Description
Q
Peak Runoff
m³/s
Maximum discharge rate from the catchment, used to size pipes and channels.
C
Runoff Coefficient
—
Fraction of rainfall becoming runoff. 0.05 woodland to 0.95 asphalt and roofs.
i
Rainfall Intensity
mm/hr
Average intensity over the time of concentration, for the chosen return period.
A
Drainage Area
hectares
Contributing catchment area. The method's validity falls away above 50 to 80 ha.
t_c
Time of Concentration
min
Travel time from the furthest point to the outlet; sets the storm duration used for i.
How to Use This Calculator
Take the intensity from local IDF dataRainfall intensity depends on the return period and the storm duration, and both come from local intensity-duration-frequency curves. Use the intensity for a storm lasting the time of concentration, at the return period your design standard requires.
Area-weight the runoff coefficientA mixed catchment needs a weighted C: multiply each surface's coefficient by its area, sum, and divide by the total. A development of 40% roof, 30% paving and 30% garden is a very different number from any single value.
Check the catchment sizeThe method assumes uniform rainfall over the whole area for the full storm duration. Above roughly 50 to 80 hectares that stops being realistic and the method overestimates. Use a hydrograph method such as a unit hydrograph or a routing model for larger catchments.
Allow for future developmentThe runoff coefficient reflects present land use. Urbanisation can triple it, so a pipe sized for today's grassland may be undersized within a decade. Where development is foreseeable, design on the future coefficient.
Use the peak for pipes and the volume for storagePeak flow sizes conveyance — pipes, channels, culverts. Volume sizes attenuation — tanks, ponds, soakaways. They are different questions, and a design that satisfies one may not satisfy the other.
Worked Examples
Example 1
A 5 hectare development has a weighted runoff coefficient of 0.65. The design storm intensity is 50 mm/hr. Find the peak runoff and the hourly volumes.
Step-by-Step Solution
Peak runoff: Q = C × i × A / 360 = 0.65 × 50 × 5 / 360
= 162.5 / 360 = 0.451 m³/s
In litres per second: 0.451 × 1000 = 451.4 L/s
Catchment area in square metres: 5 ha × 10,000 = 50,000 m²
Rainfall volume in one hour: (50/1000) × 50,000 = 2,500 m³
Runoff volume in one hour: 0.65 × 2,500 = 1,625 m³
Assessment: 451 L/s sizes the outfall pipe. The 1,625 m³ of runoff is what an attenuation tank would have to hold if discharge were restricted to greenfield rate — a very different and much larger design problem.
Example 2
The same 5 hectare site before and after development — grassland at C = 0.20 becoming a mixed development at C = 0.65. This is the calculation behind every attenuation requirement.
Developed condition, C = 0.65: Q = 0.451 m³/s = 451.4 L/s
The peak flow has risen by a factor of 3.25 — exactly the ratio of the coefficients, since everything else is unchanged
Runoff volume rises in the same proportion: from 500 m³ to 1,625 m³ per hour
The regulatory consequence: most drainage authorities now require post-development discharge to be restricted to the greenfield rate, here 139 L/s.
That means attenuating the difference — 451.4 − 138.9 = 312.5 L/s at peak — for the duration of the storm. Over a one-hour event that is roughly 1,125 m³ of storage.
This is why sustainable drainage systems exist, and why the runoff coefficient is the number a planning authority looks at first.
Rainfall Intensity Sensitivity
Peak runoff is directly proportional to intensity, so the relationship is a straight line through the origin. What changes non-linearly is the return period behind each intensity — a modest increase in design storm severity can represent a large jump in rarity. The marker shows your current intensity.
Peak Runoff vs Rainfall Intensity (i)
Recomputed live from your inputs. The marker shows your current value.
Line chart of Peak Runoff against Rainfall Intensity (i). The same
values are listed in the data table below.
Values plotted above, sampled across the rainfall intensity (i) range.
How to Interpret Your Results
Peak flow sizes the conveyance and volume sizes the storage, so both outputs matter but answer different questions. The bands below relate the peak flow to the drainage infrastructure it implies.
Peak Runoff: < 50Small catchment flow
A peak flow of your result L/s is modest — the scale of a single property or a small car park. A 150 to 225 mm pipe will typically convey it. Where discharge to a watercourse is restricted, a soakaway or small attenuation feature is usually sufficient.
Peak Runoff: 50 – 500Typical development flow
A peak flow of your result L/s corresponds to a site of a few hectares. Expect a 300 to 600 mm outfall, and check whether the discharge rate must be restricted to greenfield — if so, the attenuation volume rather than the pipe will govern the design.
A peak flow of your result L/s implies a substantial catchment. Confirm the contributing area is within the Rational Method's range of roughly 50 to 80 hectares; beyond that the uniform rainfall assumption fails and the method overestimates.
Peak Runoff: ≥ 2000Beyond the Rational Method's range
A peak flow of your result L/s indicates a catchment almost certainly too large for this method. Rainfall does not fall uniformly across a large area for the full duration of a long storm. Use a hydrograph or routing model instead.
An hourly runoff volume of your result m³ is significant for storage design. Where discharge is restricted to greenfield rate, the attenuation volume needed is the difference between inflow and permitted outflow, integrated over the critical storm duration — which may be longer than one hour.
Common Mistakes to Avoid
Applying the method to a large catchment
Why it matters:It assumes uniform rainfall over the whole area for the entire storm duration. On a catchment of hundreds of hectares, a storm cell does not cover everything at once, and the method overestimates the peak substantially.
✓How to avoid it:Limit use to catchments below roughly 50 to 80 hectares. Beyond that, use a unit hydrograph, a routing model or the relevant national flood estimation procedure.
Using a single runoff coefficient for a mixed catchment
Why it matters:Roofs and asphalt run off at 0.85 to 0.95 while lawns run at 0.20. Applying one value to a site containing both can be badly wrong in either direction.
✓How to avoid it:Area-weight the coefficient across the surface types. On a typical residential development the weighted value lands around 0.4 to 0.6 rather than at either extreme.
Using the wrong storm duration for the intensity
Why it matters:Rainfall intensity falls as duration rises. The Rational Method requires the intensity for a storm lasting the time of concentration — using a longer duration gives a lower intensity and understates the peak.
✓How to avoid it:Compute the time of concentration first, then read the intensity for that duration at the required return period from the local IDF curves.
Designing for present land use only
Why it matters:The runoff coefficient reflects the surface as it is today. Urbanisation can triple it, so a system sized for grassland becomes inadequate as development proceeds upstream.
✓How to avoid it:Consider the foreseeable future land use, particularly where the catchment includes undeveloped land with planning allocation.
Sizing storage from the peak flow
Why it matters:Peak flow and volume are different quantities. A tank sized on peak flow multiplied by an arbitrary duration will be wrong; the required volume is the integral of inflow minus permitted outflow over the critical storm.
✓How to avoid it:Use peak flow for conveyance and a volume calculation for storage, checking a range of storm durations to find the critical one — which is rarely the shortest.
Ignoring antecedent conditions
Why it matters:A saturated catchment runs off far more than a dry one, and the single coefficient C cannot represent both. Design storms following prolonged wet weather produce more runoff than the coefficient implies.
✓How to avoid it:Use coefficients appropriate to design conditions, which generally assume a wet catchment, and apply the higher end of the published range for longer return periods.
Practical Applications
▸Sizing storm drainage pipes and gullies for developments
▸Estimating peak flows for culvert design
▸Determining attenuation storage requirements
▸Assessing the drainage impact of proposed development
▸Checking existing drainage capacity against current rainfall data
▸Preliminary sizing of soakaways and infiltration systems
Industry Use Cases
Urban development drainage
Planning authorities require post-development discharge restricted to the greenfield rate, so the calculation is run twice — before and after — and the difference sets the attenuation volume. The runoff coefficient is therefore the number that determines the cost of the drainage strategy.
Highway drainage
Road surfaces run off at coefficients near 0.9, so highway catchments generate high peaks from small areas. Gully spacing is set by the flow that can be intercepted before water spreads dangerously across the carriageway, rather than by pipe capacity.
Flood risk assessment
The Rational Method is used for the small catchments within a site, while the wider catchment is modelled with hydrograph methods. Mixing the two requires care, since the Rational peak and a hydrograph peak are not directly comparable.
Expert Tips
💡Peak flow sizes pipes; volume sizes tanks. They are different calculations with different critical storms.
💡Area-weight the runoff coefficient — a single value rarely represents a real site.
💡Read the intensity at a duration equal to the time of concentration, not an arbitrary one hour.
💡Urbanisation can triple the coefficient, which is why attenuation is now routinely required.
💡Stay below about 50 to 80 hectares; beyond that the uniform rainfall assumption fails.
💡The critical storm for storage is rarely the shortest one — check a range of durations.
Advantages & Limitations
Advantages
✓Requires only three inputs, all readily available
✓Well established, with more than a century of design practice behind it
✓Returns volume alongside peak flow, covering both conveyance and storage questions
✓Transparent enough to check by hand and defend in review
✓Adequate accuracy for the small urban catchments it was developed for
Limitations
!Valid only for small catchments, broadly below 50 to 80 hectares
!Assumes uniform rainfall intensity over the whole area for the full storm duration
!Gives a peak flow only, not a hydrograph, so it cannot be routed
!The runoff coefficient bundles several distinct processes into one empirical number
!Takes no account of antecedent wetness, which strongly affects real runoff
!Ignores channel and pipe storage, which attenuates peaks in reality
!The one-hour volume outputs assume the storm lasts exactly one hour
Runoff Coefficients by Surface Type
The coefficient spans a factor of nearly twenty across surface types, which is why area-weighting matters and why development has such a large drainage impact. Values are for design storms on a wet catchment.
Indicative design coefficients. Local standards and antecedent conditions both shift these, and steeper ground raises every value.
A formula for peak stormwater runoff: Q = CiA/360 in metric units, where C is the runoff coefficient, i the rainfall intensity in mm/hr and A the area in hectares. It has been the standard approach for small urban catchments since the 1880s.
What is a runoff coefficient?
The fraction of rainfall that becomes surface runoff rather than infiltrating, evaporating or being intercepted. It ranges from about 0.05 for flat woodland to 0.95 for asphalt and roofs, and is area-weighted for mixed catchments.
How large a catchment can the Rational Method handle?
Broadly up to 50 to 80 hectares, though standards vary. Beyond that the assumption of uniform rainfall over the whole area for the full storm duration stops being realistic, and the method overestimates the peak.
What is time of concentration?
The time water takes to travel from the most hydraulically remote point of the catchment to the outlet. The Rational Method uses it as the storm duration, because only then does the whole catchment contribute to the outflow simultaneously.
Where do I get rainfall intensity?
From local intensity-duration-frequency data, published by the national meteorological service or in design standards. You need the intensity for a storm lasting the time of concentration at the required return period.
How does development affect runoff?
Substantially. Replacing grassland at C = 0.20 with a mixed development at C = 0.65 more than triples the peak flow from the same rainfall. This is why planning authorities require post-development discharge to be restricted to the greenfield rate.
How do I size an attenuation tank?
Not from the peak flow. The volume required is the integral of inflow minus permitted outflow over the critical storm, which means checking a range of storm durations. The critical one is rarely the shortest, since longer storms deliver more total volume.
What return period should I design for?
It depends on the standard and the consequence of failure. Typical requirements are 1 in 30 years for pipe capacity with no surface flooding, and 1 in 100 years plus a climate change allowance for the overall drainage strategy.
Should I allow for climate change?
Yes, and it is generally mandatory. Most standards now require an uplift on rainfall intensity — commonly 20 to 40% depending on region and design horizon — applied before the runoff calculation.
Why does the metric formula divide by 360?
It is a unit conversion. One mm/hr falling on one hectare is 10 m³/hr, which is 1/360 m³/s. The US customary form Q = CiA needs no constant because inches per hour on acres happens to give cubic feet per second almost exactly.
Glossary
Rational Method
The relationship Q = CiA for peak runoff from a catchment, standard for small urban areas.
Runoff coefficient (C)
The fraction of rainfall becoming surface runoff, bundling infiltration, storage and evaporation into one value.
Rainfall intensity (i)
The rate of rainfall over a specified duration, from local intensity-duration-frequency data.
Time of concentration
The travel time from the most remote point of a catchment to its outlet.
Return period
The average interval between events of a given severity, such as a 1 in 30 year storm.
Greenfield runoff rate
The discharge a site produced before development, often the limit imposed on post-development discharge.
Attenuation
Temporary storage of runoff to reduce the peak discharge rate leaving a site.
Impervious area
Surfaces such as roofs and paving that permit no infiltration and produce near-total runoff.
Antecedent conditions
The wetness of a catchment before a storm, which strongly affects how much rainfall runs off.
Scientific & Standards References
Kuichling, E., The Relation Between the Rainfall and the Discharge of Sewers in Populous Districts, Transactions ASCE (1889) — American Society of Civil Engineers
CIRIA C753 — The SuDS Manual — Construction Industry Research and Information Association
EN 752 — Drain and sewer systems outside buildings — CEN
Chow, V. T., Maidment, D. R. & Mays, L. W., Applied Hydrology — McGraw-Hill
Conclusion
The Rational Method gives peak runoff as CiA/360, and its value lies in knowing where it applies. It assumes rainfall falls uniformly across the catchment for the whole storm, which holds for a car park and fails for a river basin — hence the practical limit around 50 to 80 hectares. The runoff coefficient carries the most judgement and the most consequence: it spans a factor of nearly twenty across surface types, and urbanisation tripling it is precisely why attenuation storage is now routinely required. Two outputs, two purposes: peak flow sizes the pipe, volume sizes the tank, and the critical storm for each is rarely the same one.
Estimate your own catchment above, then sweep the rainfall intensity in the chart to see the peak flow respond.