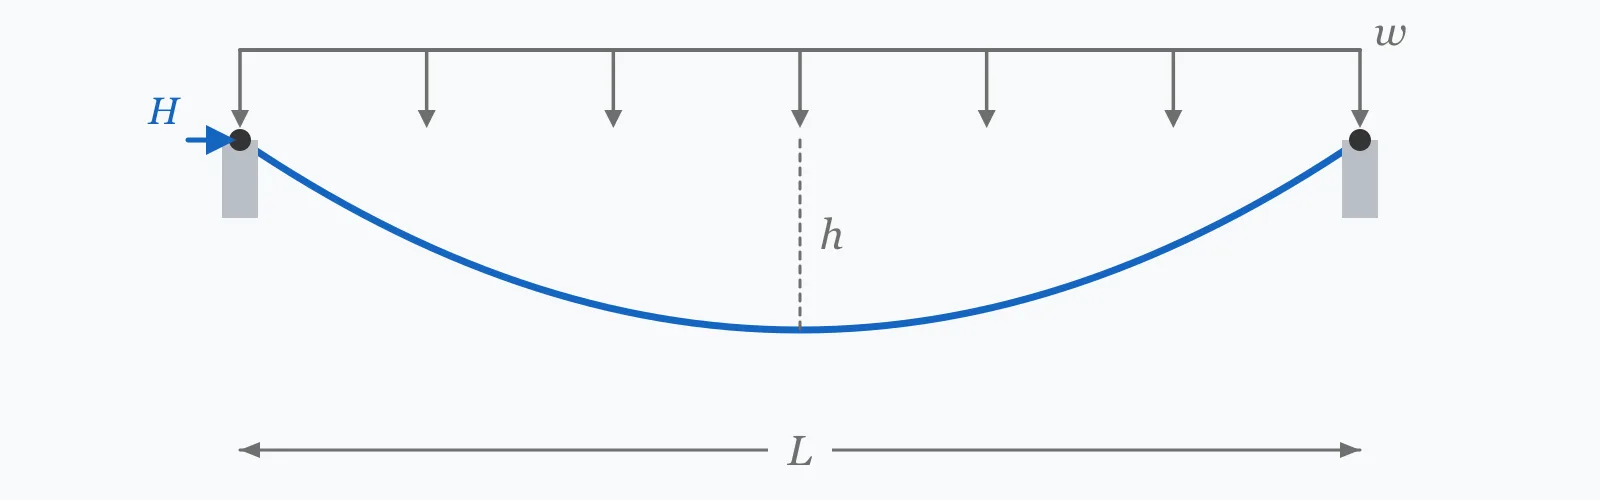
A cable carrying a uniform load takes a parabolic shape whose horizontal tension is H = wL²/(8h). The maximum tension, at the supports, is √(H² + V²) with V = wL/2. Enter the load, span and sag to get both. Sag is the critical variable: halving it doubles the tension, which is why flat-looking cables are the most highly stressed.
Calculator
Units:
kN/m
Load per metre of horizontal span, including cable self-weight
m
Horizontal distance between supports
m
Vertical drop at midspan; aim for L/8 to L/12
Calculation Result
Press Calculate for the horizontal tension, constant along the cable, and the maximum tension at the supports. Design the cable and its anchorages for the maximum value; the horizontal component is what the towers and foundations must resist.
Step-by-Step Solution
Preliminary design aid. Results follow the published formulas cited
below and are intended for estimating, study and early design. Final design must be
verified by a licensed Professional Engineer against the code in force for your project.
Key Benefits
✓Returns both the constant horizontal tension and the peak tension at the supports
✓Makes the inverse sag relationship explicit and quantifiable
✓Includes the sag-to-span guidance used in suspension structure design
✓States where the parabolic approximation stops being valid
✓Sensitivity chart shows how sharply tension climbs as sag is reduced
✓Shareable links and CSV export for design records
What Is Cable Tension?
A cable has no bending stiffness, so it can only carry load by changing shape until every element is in pure tension. Under a load distributed uniformly along the horizontal — the deck of a suspension bridge, hung from the cable by closely spaced hangers — the resulting profile is a parabola. Vertical equilibrium of half the cable gives the horizontal component of tension as H = wL²/(8h), where h is the sag at midspan. That horizontal component is constant along the whole cable; only the vertical component varies.
Why sag is the dominant variable
Sag appears in the denominator, so tension is inversely proportional to it. A cable sagging 5 m over a 100 m span carries twice the tension of one sagging 10 m under the same load. Designers therefore face a direct trade: more sag means less tension, smaller cables and cheaper anchorages, but taller towers and more headroom consumed. Typical suspension bridges settle on a sag-to-span ratio between 1:8 and 1:12, which balances the two.
Parabola or catenary?
The parabola applies when the load is uniform along the horizontal projection, as with a suspended deck. A cable carrying only its own weight — a power transmission line, or an unloaded guy — has load uniform along its own length instead, and takes a catenary shape. The two are close for shallow sags: below a sag-to-span ratio of about 1:10 the difference is under 1%, and the parabolic result is normally used. Beyond roughly 1:5 the divergence becomes significant and the catenary solution is required.
Formula
H = wL² / (8h)
Horizontal tension in a parabolic cable under uniform load, constant along its length
Related Formulas
V = wL / 2
T_max = √(H² + V²)
s ≈ L(1 + 8h²/3L²)
y = 4h·x(L − x)/L²
Variable Definitions
Symbol
Variable
Unit
Description
H
Horizontal Tension
kN
The horizontal component of tension, constant along the cable and equal to the tension at midspan.
T_max
Maximum Tension
kN
Peak tension at the supports, where the cable slope is greatest. This is the design value.
w
Uniform Load
kN/m
Load per metre of horizontal span, including the cable's own weight.
L
Span
m
Horizontal distance between supports. Tension grows with its square.
h
Sag
m
Vertical drop from the support line to the lowest point. Tension is inversely proportional to it.
V
Vertical Reaction
kN
Vertical force at each support, half the total load for a symmetric cable.
How to Use This Calculator
Confirm the load is uniform along the horizontalThe parabolic result assumes load distributed evenly across the span, as with a deck hung from closely spaced hangers. A cable carrying only its own weight is loaded along its length instead and follows a catenary.
Include the cable's own weight in the loadFor long spans the cable can be a significant fraction of the total. Estimate it from an initial cable size, include it in w, then revisit once the section is chosen.
Enter the sag at midspanMeasure from the line joining the supports down to the lowest point. For supports at different levels the geometry changes and this simple expression no longer applies directly.
Design the cable for the maximum tensionPeak tension occurs at the supports, where the cable is steepest. Size the cable and its terminations for that value, applying the appropriate safety factor — typically between 2.0 and 3.0 against breaking load for structural cables.
Design the towers and anchorages for the horizontal componentThe horizontal tension is what pulls the towers inward and must be resisted by the anchorages. It does not diminish along the cable, so it is the same at every point including midspan.
Worked Examples
Example 1
A cable spans 100 m carrying a uniformly distributed load of 10 kN/m, with a midspan sag of 10 m. Find the horizontal and maximum tensions.
Step-by-Step Solution
Sag-to-span ratio: h/L = 10/100 = 1:10, comfortably inside the range where the parabolic approximation is accurate
The maximum tension exceeds the horizontal component by only 7.7%, which is typical for a shallow cable — the cable is nearly horizontal over most of its length.
Example 2
The same cable and load, but the sag is halved from 10 m to 5 m to reduce the tower height. This is the trade that catches designers out.
Comparison: halving the sag exactly doubled the horizontal tension, from 1,250 to 2,500 kN, and raised the maximum tension by 89%
The consequences compound: the cable section roughly doubles, and the anchorage must resist twice the horizontal pull — usually a far larger cost than the tower height saved.
Note also how the ratio Tmax/H fell from 1.077 to 1.020. A flatter cable is more nearly horizontal throughout, so the maximum and horizontal tensions converge.
Sag Sensitivity
Tension is inversely proportional to sag, so the curve rises steeply as sag is reduced and flattens as it grows. The knee is where extra sag stops paying for itself — usually around a sag-to-span ratio of 1:10. The marker shows your current sag.
Max Tension (Tmax) vs Sag (h)
Recomputed live from your inputs. The marker shows your current value.
Line chart of Max Tension (Tmax) against Sag (h). The same
values are listed in the data table below.
Values plotted above, sampled across the sag (h) range.
How to Interpret Your Results
Tension itself has no universal limit — that depends on the cable specified. What is worth reading is the sag-to-span ratio implied by your inputs, since it determines both the efficiency of the geometry and whether the parabolic approximation is still valid.
Max Tension (Tmax): < 200Light cable duty
A maximum tension of your result kN is modest, in the range of guy wires, catenary supports and light suspended walkways. Apply a safety factor of 2.0 to 3.0 against the cable's breaking load, and check the anchorage as carefully as the cable.
Max Tension (Tmax): 200 – 2000Structural cable range
A maximum tension of your result kN corresponds to structural cable work — footbridges, cable-stayed roofs and suspended services. Design the cable and terminations for this peak value, and the towers and anchorages for the horizontal component.
Max Tension (Tmax): ≥ 2000Heavy cable — check the sag ratio
A maximum tension of your result kN is substantial. Before sizing the cable, check whether extra sag is available: tension is inversely proportional to sag, so a modest geometric change reduces cable and anchorage cost immediately and proportionally.
Common Mistakes to Avoid
Sizing the cable for the horizontal tension
Why it matters:The horizontal component is the tension at midspan, not the peak. Maximum tension occurs at the supports and exceeds it — by 7.7% at a 1:10 sag ratio, and much more for a deeply sagging cable.
✓How to avoid it:Size the cable and its terminations for Tmax = √(H² + V²). Use the horizontal component for tower and anchorage design, where it is the relevant force.
Applying the parabolic formula to a self-weight-only cable
Why it matters:A cable carrying only its own weight is loaded uniformly along its length, not along the horizontal, and follows a catenary. For deep sags the parabolic result diverges noticeably.
✓How to avoid it:Use the parabolic form for suspended decks and distributed loads. For power lines, unloaded guys and deep sags, use the catenary solution — the difference is under 1% only below about a 1:10 sag ratio.
Reducing sag to save on tower height
Why it matters:Tension is inversely proportional to sag, so halving it doubles the cable force. The cable section and every anchorage grows accordingly, usually costing far more than the tower height saved.
✓How to avoid it:Cost the whole system rather than one element. Sag-to-span ratios between 1:8 and 1:12 exist because that is where the total optimum sits for most suspension structures.
Ignoring cable elongation and its effect on sag
Why it matters:A cable under tension stretches elastically, and the sag it settles at is not the sag it was erected with. On long spans the change is enough to alter both the geometry and the tension appreciably.
✓How to avoid it:Iterate between tension, elongation and sag until they are consistent, or specify the unstressed cable length required to achieve the target sag under load.
Forgetting temperature effects
Why it matters:Steel cable expands roughly 12 microstrain per degree. Over a long span a 30 °C temperature swing changes the length enough to alter sag materially — and because tension is inversely proportional to sag, it changes tension too.
✓How to avoid it:Check tension at both the maximum and minimum design temperatures. The cold case gives the highest tension and usually governs the cable and anchorage design.
Treating a point load as if it were distributed
Why it matters:A concentrated load makes the cable adopt a straight-segment shape with a kink at the load, not a smooth parabola. The tension distribution is entirely different.
✓How to avoid it:For discrete loads, analyse the cable as a series of straight segments with equilibrium at each load point. The parabola applies only to genuinely distributed loading.
Practical Applications
▸Preliminary design of suspension and cable-stayed footbridges
▸Sizing cables and anchorages for suspended roofs and canopies
▸Checking guy wire tension on masts and towers
▸Estimating sag and tension in overhead catenary systems
▸Assessing temporary suspension arrangements in construction
▸Determining anchorage forces for tensioned membrane structures
Industry Use Cases
Bridge engineering
Suspension bridge main cables are optimised on sag-to-span ratio, since it drives cable area, tower height and anchorage size at once. Ratios between 1:8 and 1:12 dominate because that is where the total cost curve bottoms out across all three.
Electrical transmission
Conductor tension varies with temperature and ice loading, and sag must be verified at the extremes to maintain statutory ground clearance. Because these cables carry only their own weight, the catenary rather than the parabola applies.
Architectural and lightweight structures
Cable-supported roofs and tensile canopies are governed as much by anchorage as by cable. Since the horizontal component must be resisted at the boundary, engineers often accept more sag specifically to reduce the foundation forces.
Expert Tips
💡Tension is inversely proportional to sag: halving the sag doubles the force in the cable and at the anchorage.
💡Aim for a sag-to-span ratio between 1:8 and 1:12 for suspension structures; that is where the total cost usually bottoms out.
💡Design the cable for Tmax and the towers and anchorages for H — they are different forces with different destinations.
💡Below a 1:10 sag ratio, the parabolic and catenary results differ by under 1%, so the simpler form is fine.
💡Check the cold-temperature case: a contracted cable has less sag and therefore more tension.
💡The anchorage is frequently the costliest part of a cable system. Reducing horizontal tension is worth more than saving cable.
Advantages & Limitations
Advantages
✓Closed-form and exact for a parabolic cable under uniform load
✓Requires only three inputs, all available from the intended geometry
✓Separates the horizontal component from the peak, matching how the two are actually used
✓Makes the sag trade-off directly visible and quantifiable
✓Fast enough to sweep sag ratios during concept design
Limitations
!Assumes load uniform along the horizontal span, not along the cable length
!Assumes supports at the same level; unequal supports need the asymmetric solution
!Diverges from the true catenary above a sag-to-span ratio of roughly 1:5
!Takes no account of elastic elongation, which alters the sag actually achieved
!Ignores temperature effects on length and hence on tension
!Not valid for concentrated loads, which produce a kinked rather than smooth profile
!Does not address dynamic effects such as cable vibration, galloping or flutter
Tension by Sag-to-Span Ratio
The same 100 m cable carrying 10 kN/m at different sags. The vertical reaction never changes, since it depends only on the total load — everything that varies comes from the geometry.
Parabolic cable, 100 m span, 10 kN/m uniform load. Vertical reaction is 500 kN in every case. Below 1:5 the catenary solution should be used instead.
For a cable under uniform load, the horizontal tension is H = wL²/(8h), where w is the load per metre, L the span and h the midspan sag. Maximum tension at the supports is √(H² + V²) with V = wL/2. A 100 m cable at 10 kN/m sagging 10 m carries 1,250 kN horizontally and 1,346 kN at the supports.
How does sag affect cable tension?
Inversely and directly: halving the sag doubles the tension. A cable sagging 5 m over 100 m carries twice the force of one sagging 10 m under the same load. This is why apparently taut cables are the most highly stressed.
Where is cable tension greatest?
At the supports, where the cable slope is steepest and the vertical component of tension is largest. At midspan the cable is horizontal and the tension equals the horizontal component alone, which is the minimum along the cable.
What is the difference between a catenary and a parabola?
A catenary is the shape a cable takes under its own weight, distributed along its length. A parabola is the shape under load distributed along the horizontal, as with a suspended deck. Below a sag-to-span ratio of about 1:10 they differ by under 1%.
What sag-to-span ratio should I use?
Between 1:8 and 1:12 for most suspension structures. Less sag means higher tension, larger cables and bigger anchorages; more sag means taller towers and lost headroom. That range is where the combined cost typically bottoms out.
Why is the horizontal tension constant along the cable?
Because no horizontal forces are applied along its length — the load is entirely vertical. Horizontal equilibrium of any cable segment therefore requires the horizontal component to be identical everywhere, while the vertical component grows towards the supports.
Should I design the cable for H or for Tmax?
For Tmax, since that is the peak force the cable actually carries. Use the horizontal component H for the towers and anchorages, which must resist the inward pull. Confusing the two undersizes the cable by up to 30% at deep sags.
Does temperature change cable tension?
Yes. Steel cable contracts about 12 microstrain per degree of cooling, reducing sag and therefore raising tension. Over a long span a 30 °C swing produces a meaningful change, and the cold case usually governs the cable and anchorage design.
What safety factor applies to structural cables?
Typically 2.0 to 3.0 against the minimum breaking load, depending on the code, the consequence of failure and whether the cable is replaceable. Bridge main cables and non-replaceable elements sit at the higher end.
Can I use this for a guy wire?
For a preliminary estimate, yes, provided the guy carries a distributed load. But an unloaded guy carries only its own weight and follows a catenary, and guys are usually pretensioned to a specified force rather than allowed to find their own sag.
Glossary
Sag
The vertical drop from the line joining the supports to the lowest point of the cable.
Horizontal tension (H)
The horizontal component of cable tension, constant along the cable and equal to the tension at midspan.
Maximum tension (Tmax)
The peak tension at the supports, where the cable slope and vertical component are greatest.
Sag-to-span ratio
Sag divided by span, the primary geometric parameter of a cable structure; typically 1:8 to 1:12.
Catenary
The hyperbolic cosine curve a cable adopts under its own weight, distributed along its length.
Parabola
The curve a cable adopts under load distributed uniformly along the horizontal span.
Anchorage
The foundation or structural element that resists the horizontal pull of a cable at its termination.
Hanger
A vertical member transferring load from a deck to a main suspension cable.
Developed length
The true length of the cable along its curve, longer than the span by an amount that grows with sag.
Scientific & Standards References
Irvine, H. M., Cable Structures — MIT Press
Gimsing, N. J. & Georgakis, C. T., Cable Supported Bridges: Concept and Design, 3rd Edition — Wiley
Hibbeler, R. C., Structural Analysis, 10th Edition — Chapter 5: Cables and Arches — Pearson
EN 1993-1-11 — Design of structures with tension components — CEN
ASCE 19 — Structural Applications of Steel Cables for Buildings — American Society of Civil Engineers
Conclusion
A cable under uniform load takes a parabolic shape whose horizontal tension is wL²/(8h), constant along its length, with the peak occurring at the supports. Sag is the variable that matters: because it sits in the denominator, halving it doubles the cable force and the anchorage force together, which is why flat cables are expensive rather than efficient. Design the cable for the maximum tension and the towers and anchorages for the horizontal component — they are different numbers with different destinations. And check the sag-to-span ratio before trusting the result: beyond about 1:5 the cable is behaving as a catenary and this approximation no longer holds.
Try your own geometry above, then sweep the sag in the chart to see how sharply tension climbs as the cable is pulled flat.