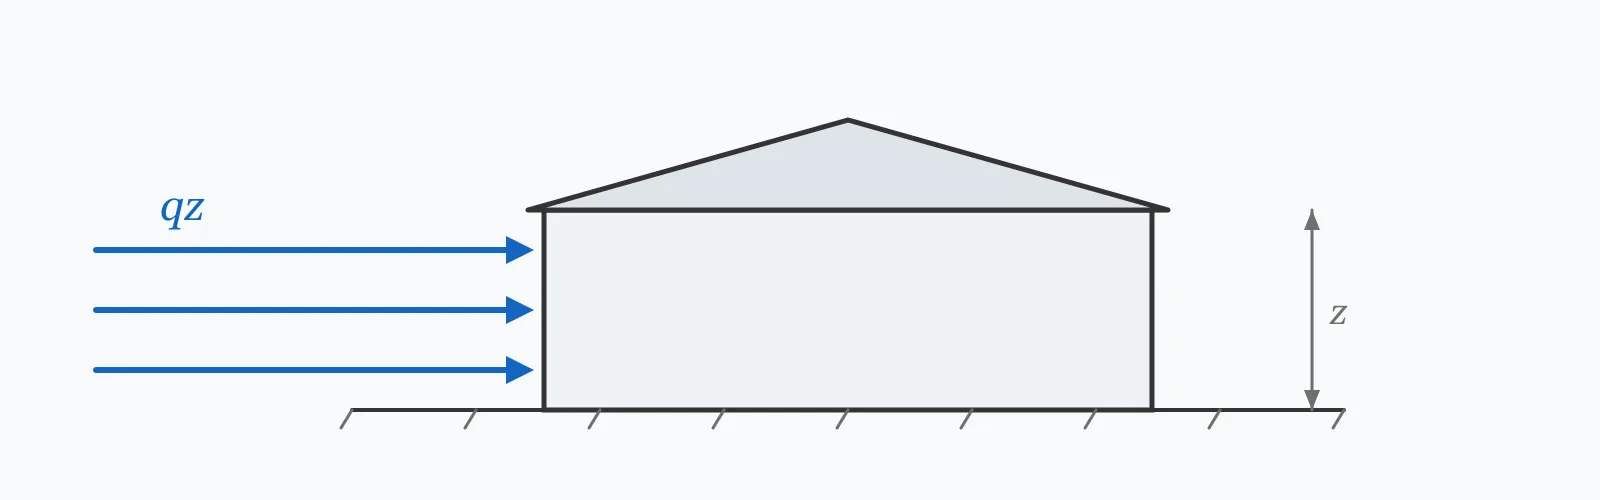
Wind velocity pressure follows qz = 0.613·Kz·V², where Kz is the exposure coefficient that grows with height. Enter the basic wind speed, height above ground and exposed area to get the velocity pressure and the corresponding reference force. This is the starting point of an ASCE 7 calculation, not the finished design pressure — the directionality, gust and pressure coefficients still have to be applied.
Calculator
Units:
m/s
3-second gust at 10 m, from the wind map for your risk category
m
Height of the surface considered; 10 m is the reference height
m²
Projected area normal to the wind direction
Calculation Result
Press Calculate for the velocity pressure at your height and the reference force on the exposed area. To reach a design pressure, multiply by the directionality factor Kd, the gust effect factor G and the pressure coefficient Cp for your surface — see the How to Use section.
Step-by-Step Solution
Preliminary design aid. Results follow the published formulas cited
below and are intended for estimating, study and early design. Final design must be
verified by a licensed Professional Engineer against the code in force for your project.
Key Benefits
✓Computes the ASCE 7 velocity pressure equation directly, with the height-dependent Kz
✓Returns both pressure and reference force so either can be carried forward
✓States plainly which coefficients still have to be applied — no false completeness
✓Includes the Kd, G and Cp values needed to finish a main wind-force-resisting-system check
✓Sensitivity chart shows the quadratic effect of wind speed
✓Shareable links and CSV export for design records
What Is Wind Load?
Velocity pressure is the stagnation pressure a moving airstream would exert if brought completely to rest. It derives from Bernoulli's equation as ½ρV², and with the density of air at standard conditions the coefficient becomes 0.613 when speed is in metres per second and pressure in pascals. ASCE 7 writes it as qz = 0.613·Kz·Kzt·Kd·Ke·V², where the additional factors adjust for terrain exposure, topography, wind directionality and ground elevation.
Why the exposure coefficient grows with height
Friction with the ground slows wind near the surface, creating an atmospheric boundary layer in which speed increases with height. ASCE 7 captures this with Kz = 2.01(z/zg)^(2/α), where zg is the gradient height and α a terrain exponent. This calculator uses Exposure C — open terrain with scattered obstructions — for which zg is 274.32 m and α is 9.5. At the 10 m reference height Kz is almost exactly 1.00, rising to about 1.26 at 30 m and 1.55 at 80 m.
What still has to be applied
Velocity pressure is not design pressure. For the main wind-force-resisting system, ASCE 7 gives p = q·G·Cp − qi·(GCpi): the velocity pressure is multiplied by a gust effect factor G, typically 0.85 for a rigid building, and by an external pressure coefficient Cp that depends on which surface is being considered — 0.8 on a windward wall, −0.5 on a leeward wall, and as much as −1.4 near a roof corner. The directionality factor Kd, usually 0.85, and any topographic factor Kzt must also be included. This calculator supplies q; the rest belongs to your code check.
Formula
q_z = 0.613 · K_z · V²
Velocity pressure in N/m² at height z, with V in m/s (ASCE 7, Exposure C)
Related Formulas
K_z = 2.01 (z / z_g)^(2/α)
p = q · G · C_p − q_i · (GC_pi)
q_z = 0.613 · K_z · K_zt · K_d · K_e · V²
F = p · A
Variable Definitions
Symbol
Variable
Unit
Description
q_z
Velocity Pressure
N/m²
Stagnation pressure of the airstream at height z, before gust and pressure coefficients.
V
Basic Wind Speed
m/s
3-second gust speed at 10 m in Exposure C, taken from the wind speed map for the relevant risk category.
K_z
Exposure Coefficient
—
Height and terrain adjustment. About 1.00 at 10 m in Exposure C, rising with height.
z
Height Above Ground
m
Height of the surface being considered, measured from ground level.
A
Exposed Area
m²
Projected area normal to the wind over which the pressure acts.
G·C_p
Gust and Pressure Coefficients
—
Applied after this calculation. Typically 0.85 × 0.8 on a windward wall.
How to Use This Calculator
Take the basic wind speed from the map, not from local recordsASCE 7 wind speeds are 3-second gusts at 10 m in Exposure C, mapped by risk category. Do not substitute a mean hourly speed or a measured average — they are defined differently and are substantially lower.
Enter the height of the surface being checkedFor a windward wall, ASCE 7 evaluates velocity pressure at each height. For leeward walls, side walls and roofs, it is evaluated once at the mean roof height. Use the height that matches the surface you are designing.
Confirm Exposure C appliesThis calculator uses Exposure C — open terrain with scattered obstructions. Exposure B, for suburban and wooded terrain, gives lower pressures at low levels; Exposure D, for flat unobstructed areas and water, gives higher. Using C for a Exposure D site is unconservative.
Apply the remaining ASCE 7 coefficientsMultiply the velocity pressure by Kd ≈ 0.85 for directionality, by the gust effect factor G ≈ 0.85 for a rigid building, and by the pressure coefficient Cp for the surface. Include Kzt if the site sits on a hill or escarpment.
Combine windward and leeward pressuresTotal force on a building is the sum of positive pressure on the windward face and suction on the leeward face. Both act in the same direction on the structure, so they add rather than cancel.
Worked Examples
Example 1
A building surface 10 m above ground has an exposed area of 50 m². The basic wind speed for the site is 40 m/s and the terrain is Exposure C. Find the velocity pressure and reference force.
Reference force: F = q × A / 1000 = 981.72 × 50 / 1000 = 49.09 kN
This is velocity pressure only. To reach a windward wall design pressure:
p = q × Kd × G × Cp = 981.72 × 0.85 × 0.85 × 0.8 = 567.3 N/m²
Design force on the windward face: 567.3 × 50 / 1000 = 28.4 kN — about 58% of the reference figure, which is why the remaining coefficients cannot be skipped.
Example 2
The same 50 m² area, but on a surface 40 m above ground on a taller building. This shows how much the exposure coefficient adds with height.
Comparison against the 10 m case: pressure rose from 981.72 to 1,314.40 N/m², a 34% increase for the same wind speed
This is why tall buildings are checked at multiple heights on the windward face — a single pressure taken at ground level would understate loads on the upper storeys substantially.
Wind Speed Sensitivity
Pressure grows with the square of wind speed, so the curve steepens sharply to the right. Sweeping the speed shows why a coastal site with a 20% higher design speed needs roughly 44% more lateral capacity. The marker shows your current design speed.
Wind Pressure (q) vs Basic Wind Speed
Recomputed live from your inputs. The marker shows your current value.
Line chart of Wind Pressure (q) against Basic Wind Speed. The same
values are listed in the data table below.
Values plotted above, sampled across the basic wind speed range.
How to Interpret Your Results
Velocity pressure is an intermediate quantity, so the bands below indicate the wind climate the computed value corresponds to rather than a pass-or-fail outcome. Remember that design pressure will be roughly 50 to 60% of these figures on a windward wall once Kd, G and Cp are applied — and can exceed them in suction at roof corners.
Wind Pressure (q): < 500Low wind pressure
A velocity pressure of your result N/m² corresponds to a sheltered low-rise situation or a mild wind climate. Lateral load is unlikely to govern the structure, but serviceability of cladding and fixings should still be checked against the local suction peaks.
Wind Pressure (q): 500 – 1500Typical building design range
A velocity pressure of your result N/m² is the normal range for buildings in temperate wind climates. Apply Kd ≈ 0.85, G ≈ 0.85 and the surface pressure coefficient to obtain the design pressure for each face.
Wind Pressure (q): 1500 – 3000High wind pressure — lateral system will govern
A velocity pressure of your result N/m² indicates a severe wind climate, a tall building, or both. Wind will almost certainly govern the lateral system over seismic. Pay particular attention to cladding and roof edge zones, where local suction coefficients reach −1.4 or worse.
Wind Pressure (q): ≥ 3000Extreme wind pressure
A velocity pressure of your result N/m² corresponds to hurricane or cyclone conditions, or to great height. Design at this level requires the full ASCE 7 procedure including internal pressure, and often wind tunnel testing. Do not rely on a simplified calculation here.
Common Mistakes to Avoid
Treating velocity pressure as design pressure
Why it matters:Velocity pressure is only the first term of the ASCE 7 expression. Omitting Kd, G and Cp overstates a windward wall pressure by roughly 70%, and understates roof corner suctions badly.
✓How to avoid it:Multiply by Kd ≈ 0.85, G ≈ 0.85 and the appropriate Cp for each surface. Use the component and cladding coefficients, not the main system ones, when designing fixings and panels.
Using a mean wind speed instead of the 3-second gust
Why it matters:ASCE 7 is calibrated to a 3-second gust at 10 m. A mean hourly speed is typically 25 to 35% lower, and since pressure varies with the square, substituting it can halve the calculated load.
✓How to avoid it:Use the mapped basic wind speed for your risk category. If working from a different averaging period, apply the appropriate conversion before entering it.
Applying Exposure C to a sheltered or an open coastal site
Why it matters:Exposure category shifts pressures materially at low level — Exposure B gives about 30% less than C near the ground, while Exposure D gives more. Getting it wrong biases every subsequent number.
✓How to avoid it:Assess the upwind terrain over the required fetch distance in every direction. Where categories differ by direction, use the worst case for the surface being designed.
Ignoring internal pressure
Why it matters:A building with a dominant opening can develop internal pressure that adds to external suction on the roof and leeward walls. In partially enclosed buildings the internal coefficient reaches ±0.55, which can dominate the net load.
✓How to avoid it:Classify the building as enclosed, partially enclosed or open, and include the qi(GCpi) term. A single large door left open in a storm changes the classification.
Using average roof coefficients at edges and corners
Why it matters:Suction concentrates dramatically at roof edges, corners and ridges — local coefficients reach −1.4 or beyond, several times the field value. Roof cladding failures almost always begin at these zones.
✓How to avoid it:Use the component and cladding coefficients from ASCE 7 Chapter 30, which give separate zones for field, edge and corner, and design fixings accordingly.
Forgetting that windward and leeward pressures add
Why it matters:Positive pressure pushes on the windward face while suction pulls on the leeward face. Both act in the same direction on the structure, so total base shear is the sum, not the larger of the two.
✓How to avoid it:Compute both faces and add them when determining the total lateral force on the main wind-force-resisting system.
Practical Applications
▸Preliminary lateral load estimates for building frames
▸Sizing cladding fixings and curtain wall supports
▸Checking signage, hoardings and free-standing walls
▸Estimating loads on scaffolding and temporary works
▸Assessing wind forces on rooftop plant and screens
▸Comparing wind against seismic to identify the governing lateral case
Industry Use Cases
Building design
During scheme design, engineers compute velocity pressure at the mean roof height and compare the resulting base shear against the seismic value. Whichever governs sets the entire lateral system, so the comparison is made before any member is sized.
Facade and cladding engineering
Cladding is governed by local suction peaks rather than by average pressures, so facade engineers apply component and cladding coefficients that can be several times the main system values, with the worst cases concentrated at corners and parapets.
Temporary works
Sheeted scaffolds and hoardings present large exposed areas at modest cost, and wind frequently governs their stability. Because pressure varies with the square of speed, the decision to sheet a scaffold can multiply its ballast requirement several times over.
Expert Tips
💡Pressure varies with the square of wind speed: a 20% higher speed means 44% more load.
💡Velocity pressure roughly doubles between ground level and 100 m in Exposure C — check tall faces at several heights.
💡Windward pressure and leeward suction act in the same direction on the structure; add them for base shear.
💡Roof corners and edges see the worst suction of any surface, and are where cladding failures usually start.
💡Compare wind against seismic early. Which governs decides the lateral system and is expensive to discover late.
💡For an unusual shape, a site in complex terrain, or a very tall building, wind tunnel testing is often cheaper than the conservatism a code procedure forces.
Advantages & Limitations
Advantages
✓Implements the ASCE 7 velocity pressure expression directly and transparently
✓Includes the height-dependent exposure coefficient rather than assuming a constant
✓Gives both pressure and reference force, so either can be carried forward
✓Fast enough to compare heights and wind speeds during scheme design
✓States its own boundaries, so the remaining code steps are not overlooked
Limitations
!Returns velocity pressure only — Kd, G, Cp and internal pressure must still be applied
!Assumes Exposure C; Exposure B and D give materially different results at low level
!Omits the topographic factor Kzt, which can multiply pressure by 1.5 or more on hills and escarpments
!Omits the ground elevation factor Ke, a minor but real adjustment at altitude
!Does not distinguish main wind-force-resisting system from component and cladding coefficients
!Takes no account of dynamic response, which matters for slender or flexible structures
!Not applicable to open structures, lattice towers or free-standing signs without their own force coefficients
Velocity Pressure by Height and Wind Speed
Velocity pressure at Exposure C, computed from qz = 0.613·Kz·V². Design pressures on a windward wall will be roughly 58% of these values once Kd, G and Cp are applied; roof corner suctions can exceed them.
Exposure C velocity pressures, with zg = 274.32 m and α = 9.5. Values are before directionality, gust and pressure coefficients.
Start with velocity pressure qz = 0.613·Kz·V², then multiply by the directionality factor Kd, the gust effect factor G and the pressure coefficient Cp for the surface. At 40 m/s and 10 m height, velocity pressure is 982 N/m², giving about 567 N/m² on a windward wall.
What is velocity pressure?
The stagnation pressure a moving airstream would exert if brought to rest, equal to ½ρV². With standard air density and speed in m/s, the constant is 0.613. It is the starting point of an ASCE 7 wind calculation, not the design pressure.
Why does wind pressure increase with height?
Ground friction slows wind near the surface, producing a boundary layer in which speed rises with height. ASCE 7 models this through Kz, which in Exposure C is about 1.00 at 10 m, 1.34 at 40 m and 1.77 at 150 m.
What is Exposure Category C?
Open terrain with scattered obstructions under 9 m tall — flat open country, grasslands and most airport surroundings. Exposure B covers suburban and wooded terrain with lower pressures at low level, and Exposure D covers flat unobstructed areas and water, with higher pressures.
What is the gust effect factor G?
A factor accounting for the fact that peak gusts do not load an entire building simultaneously, and for the building's dynamic response. It is taken as 0.85 for a rigid building; flexible structures with a natural frequency below 1 Hz require the dynamic procedure of ASCE 7 §26.11.
What pressure coefficient should I use?
For the main wind-force-resisting system, Cp is typically 0.8 on a windward wall and −0.5 on a leeward wall, with roof values varying with pitch. For cladding and fixings, use the component and cladding coefficients of Chapter 30, which are considerably more severe at edges and corners.
Do windward and leeward pressures add together?
Yes. Positive pressure pushes on the windward face while suction pulls on the leeward face, and both act in the same direction on the structure. Total base shear is the sum, which is why leeward suction cannot be ignored.
How does wind speed affect load?
Quadratically. Doubling the wind speed quadruples the pressure, and a 20% increase produces 44% more load. This is why coastal and hurricane-zone structures need substantially more lateral capacity than inland ones a short distance away.
What is internal pressure and when does it matter?
Pressure developed inside a building through openings, which adds to or relieves external pressures. It is small for an enclosed building, but reaches ±0.55 for a partially enclosed one — a classification a single large open door can trigger during a storm.
When is wind tunnel testing needed?
For buildings with unusual shapes, sites in complex terrain, very tall or slender structures, and cases where a code procedure would force excessive conservatism. ASCE 7 Chapter 31 permits it as an alternative, and on large projects it frequently pays for itself in saved material.
Glossary
Velocity pressure (qz)
The stagnation pressure ½ρV² of the airstream at height z, the starting quantity in an ASCE 7 wind calculation.
Basic wind speed (V)
The mapped 3-second gust speed at 10 m in Exposure C for a given risk category.
Exposure coefficient (Kz)
The factor adjusting velocity pressure for height above ground and terrain roughness.
Exposure category
A classification of upwind terrain roughness — B suburban, C open, D flat and unobstructed.
Directionality factor (Kd)
A reduction, usually 0.85, reflecting the low probability that peak wind coincides with the worst direction.
Gust effect factor (G)
A factor accounting for gust correlation across a building and its dynamic response; 0.85 for rigid structures.
Pressure coefficient (Cp)
The ratio of surface pressure to velocity pressure, varying by surface and position on the building.
Topographic factor (Kzt)
An amplification applied where a site sits on a hill, ridge or escarpment that accelerates the wind.
Internal pressure coefficient (GCpi)
The coefficient describing pressure developed inside a building through its openings.
Main wind-force-resisting system
The assembly of structural elements that transfers overall wind load to the foundations, as distinct from cladding.
Scientific & Standards References
ASCE/SEI 7-22 §26.10 — Velocity Pressure Exposure Coefficient and Velocity Pressure — American Society of Civil Engineers
ASCE/SEI 7-22 Table 26.10-1 — Velocity Pressure Exposure Coefficients Kh and Kz — American Society of Civil Engineers
ASCE/SEI 7-22 §27.3 — Wind Loads on Buildings: Main Wind Force Resisting System — American Society of Civil Engineers
ASCE/SEI 7-22 Chapter 30 — Wind Loads: Components and Cladding — American Society of Civil Engineers
EN 1991-1-4 — Eurocode 1: Actions on structures, Part 1-4: Wind actions — CEN
ASCE/SEI 7-22 Chapter 31 — Wind Tunnel Procedure — American Society of Civil Engineers
Conclusion
Wind velocity pressure follows qz = 0.613·Kz·V², rising with the square of wind speed and with height as the boundary layer thins. That quadratic dependence is the practical headline: a 20% higher design speed means 44% more load, which is why exposure category and site wind speed deserve careful checking rather than assumption. What this calculation gives is the starting quantity, not the answer — the directionality factor, gust effect factor and surface pressure coefficients still stand between velocity pressure and a design pressure, and at roof corners the component and cladding coefficients can exceed the velocity pressure itself.
Enter your own site conditions above, then sweep the wind speed in the chart to see how quickly load grows with it.