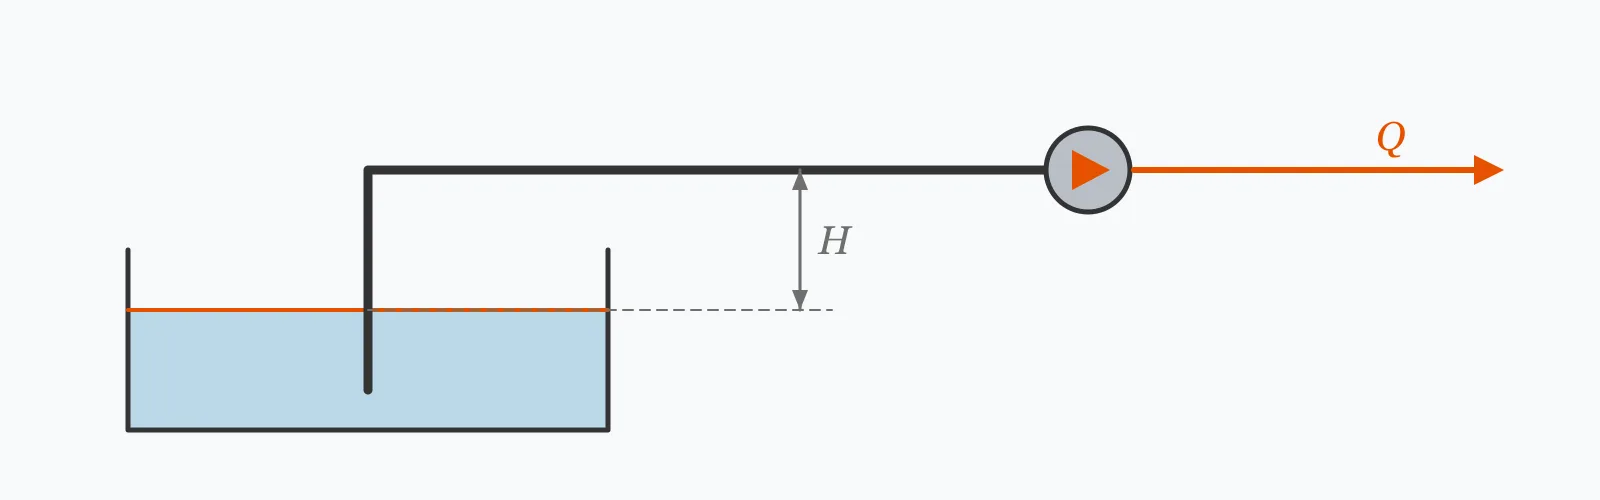
Hydraulic power is ρgQH — the work actually done on the fluid. Everything above it is loss. Enter the flow, head, fluid density and the pump and motor efficiencies to get hydraulic power, shaft power, electrical input and the specific energy in kilowatt-hours per cubic metre moved.
Calculator
Units:
m³/h
Volumetric flow at the duty point
m
Static lift plus friction losses plus pressure requirement
kg/m³
Water at 20 °C is 998 kg/m³
%
At the actual duty, not the model's peak. 70–85% for good centrifugal pumps
%
IE3 motors reach about 89 to 94%
Calculation Result
Press Calculate for the hydraulic power delivered to the fluid, the shaft power the pump needs, the electrical power the motor draws, and the specific energy per cubic metre pumped.
Step-by-Step Solution
Preliminary design aid. Results follow the published formulas cited
below and are intended for estimating, study and early design. Final design must be
verified by a licensed Professional Engineer against the code in force for your project.
Key Benefits
✓Separates hydraulic, shaft and electrical power rather than conflating them
✓Reports specific energy, which converts a duty directly into a running cost
✓Handles any fluid through its density
✓Warns when the quoted efficiency is implausible for the duty
✓Sensitivity chart shows power rising linearly with head
✓Shareable links and CSV export for design records
What Is Pump Power?
Hydraulic power is the rate at which a pump does work on the fluid: P = ρgQH, where ρ is density, Q the volumetric flow and H the total head. It is the only part of the energy that goes where it was intended. Shaft power is higher, because the pump itself is not perfectly efficient — internal recirculation, disc friction and hydraulic losses all consume input without adding head. Electrical power is higher again, because the motor has losses of its own.
Why efficiency depends on the duty point
A centrifugal pump has one flow at which it is most efficient — its best efficiency point — and efficiency falls away on both sides. Run it well below that flow and recirculation dominates; run it above and hydraulic losses rise steeply. A pump quoted at 82% may deliver 60% at a duty far from its design point, which is why oversizing a pump costs energy continuously rather than only at start-up.
Specific energy turns a duty into money
Dividing the electrical power by the flow gives the energy per cubic metre moved, in kWh/m³. That figure is directly comparable across pumps, systems and sites, and it multiplies straight into an annual cost. The example duty here consumes 0.118 kWh/m³ — so a system moving 400,000 m³ a year uses about 47,000 kWh, which at typical commercial tariffs is a running cost several times the pump's purchase price.
Formula
P_hydraulic = ρ · g · Q · H
Power delivered to the fluid, with Q in m³/s and H in metres
Related Formulas
P_shaft = P_hydraulic / η_pump
P_electrical = P_shaft / η_motor
η_overall = η_pump · η_motor
e = P_electrical / Q
Variable Definitions
Symbol
Variable
Unit
Description
Q
Flow Rate
m³/h
Volumetric flow delivered by the pump.
H
Total Head
m
Static lift plus friction losses plus any pressure requirement, expressed as head.
ρ
Fluid Density
kg/m³
998 for water at 20 °C. Denser fluids need proportionally more power.
η_pump
Pump Efficiency
%
At the actual duty point, not the peak quoted for the model.
η_motor
Motor Efficiency
%
IE3 motors reach about 89 to 94% depending on size.
e
Specific Energy
kWh/m³
Electrical energy per cubic metre pumped.
How to Use This Calculator
Use total head, not static liftTotal head is the static lift plus the friction losses through the pipework plus any pressure the system must deliver, all expressed in metres. Friction rises with roughly the square of flow, so a duty derived from static lift alone can be badly short at the working flow.
Take pump efficiency from the curve at your dutyThe headline figure on a datasheet is the peak. Efficiency falls away either side of the best efficiency point, so a pump running well off design may deliver 60% where 82% was quoted. Read the value at the actual flow.
Use the fluid's actual densityPower is directly proportional to it. A brine or a slurry at 1,200 kg/m³ needs 20% more power than water for the same flow and head, and the pump curve itself is usually published for water.
Size the motor above the shaft powerA centrifugal pump draws more power, not less, as it runs out along its curve towards lower head. Sizing the motor exactly to the duty point risks overload whenever the system resistance is lower than assumed — which is common on commissioning, before fouling builds up.
Read the specific energy for the running costMultiply it by the annual volume to get annual consumption. This is the figure that decides whether a more efficient pump is worth its premium, and on a continuous duty the answer is almost always yes.
Worked Examples
Example 1
A pump delivering 50 m³/h against 30 m of total head, handling water at 998 kg/m³, with 75% pump efficiency and a 92% efficient motor.
Specific energy: 0.1478 kWh/m³, up from 0.1182 — a 25% increase
The pump is doing identical useful work and consuming 1.48 kW more to do it.
Over a year of continuous running that is about 12,900 kWh of pure waste, which on most commercial tariffs exceeds the price difference between a correctly sized pump and an oversized one several times over.
The mechanism matters as much as the number. A pump oversized for its duty operates to the left of its best efficiency point, where internal recirculation dominates — and recirculation not only wastes energy but also causes vibration and accelerates wear on the impeller and bearings.
This is why variable speed drives pay back so readily on varying duties: instead of throttling a valve to force an oversized pump down its curve, the drive moves the whole curve so the pump stays near its efficiency peak.
Head Sensitivity
All three power series rise linearly with head, separated by the two efficiency factors. Specific energy rises linearly too, since it is power divided by a constant flow. The marker shows your current head.
Electrical Power vs Total Head
Recomputed live from your inputs. The marker shows your current value.
Line chart of Electrical Power against Total Head. The same
values are listed in the data table below.
Values plotted above, sampled across the total head range.
How to Interpret Your Results
Hydraulic power is fixed by the duty; the two efficiencies determine what it costs to deliver. Specific energy is the figure that converts the whole thing into money.
Electrical Power: < 5Small pump
An electrical demand of your result kW is a small pump. At this scale motor efficiency options are limited and the absolute savings are modest, so simplicity and reliability usually matter more than a point or two of efficiency.
Electrical Power: 5 – 50Typical industrial pump
An electrical demand of your result kW is where efficiency starts to pay properly. On continuous duty the annual electricity cost will exceed the pump's purchase price, so the duty point and the efficiency at it are worth confirming rather than assuming.
At your result kW the running cost far outweighs the capital cost over any reasonable life. A detailed duty analysis, a pump selected at its best efficiency point, and variable speed control on a varying load are all justified at this scale.
Electrical Power: ≥ 250Major energy consumer
At your result kW this pump is a significant load in its own right. System optimisation — larger pipes to cut friction head, reduced static lift where possible, multiple pumps staged to follow demand — typically saves more than any change to the pump itself.
Specific Energy: ≥ 0.5Energy-intensive duty
At your result kWh/m³ this is an expensive way to move fluid. Check whether the total head is genuinely required — friction head is often a large and reducible share, and it falls with roughly the square of velocity if the pipework is enlarged.
Common Mistakes to Avoid
Using static lift as the total head
Why it matters:Total head includes friction through the pipework and any pressure the system must deliver. Friction rises with roughly the square of flow, so on a long or narrow pipe run it can exceed the static lift entirely.
✓How to avoid it:Compute the full system curve — static plus friction at the design flow — and take the head where it intersects the pump curve. That intersection is the actual duty point, not the design intent.
Using the peak efficiency from the datasheet
Why it matters:That figure applies at one flow. A pump running well off its best efficiency point can be 20 percentage points below it, and the example above shows what that costs: 25% more energy for identical useful work.
✓How to avoid it:Read efficiency from the curve at the actual duty. If it is well below the peak, the pump is the wrong size rather than a poor pump.
Sizing the motor exactly to the shaft power
Why it matters:A centrifugal pump draws more power as head falls and flow rises. On commissioning, before fouling and scaling raise the system resistance, the pump often runs out along its curve and overloads a motor sized to the design point.
✓How to avoid it:Size the motor with margin, or check the power at the pump's maximum flow — the run-out condition — rather than at the design duty alone.
Throttling to control flow
Why it matters:A valve reduces flow by adding artificial head, so the pump still consumes power to generate head that is then destroyed across the valve. The energy is wasted entirely, and the pump moves away from its best efficiency point at the same time.
✓How to avoid it:Use a variable speed drive on a varying duty, or trim the impeller for a permanently reduced flow. Both move the pump curve rather than fighting it.
Ignoring fluid density
Why it matters:Power is directly proportional to it. Sizing on water for a fluid at 1,200 kg/m³ understates the requirement by 20%, and pump curves are almost always published for water.
✓How to avoid it:Use the actual density, and check the manufacturer's derating for viscosity as well — a viscous fluid reduces both head and efficiency in ways density alone does not capture.
Overlooking NPSH
Why it matters:This calculation gives the power required, and says nothing about whether the pump can draw the fluid in at all. A pump with ample power will still cavitate if the net positive suction head available falls below what it needs.
✓How to avoid it:Check NPSH available against NPSH required at the design flow, remembering that NPSHr rises steeply as the pump runs out along its curve.
Practical Applications
▸Sizing pump motors for a duty
▸Estimating the running cost of a pumping system
▸Comparing pump options on total cost of ownership
▸Quantifying the penalty of running off the best efficiency point
▸Assessing the benefit of reducing system friction head
▸Establishing specific energy benchmarks across a site
Industry Use Cases
Water and wastewater
Pumping is typically the largest single electricity consumer at a treatment works, so specific energy in kWh/m³ is tracked as a headline performance indicator. A rising trend usually indicates fouling, wear or a drifting duty point rather than a changed demand.
Building services
Heating and cooling circulators run for most of the year at part load. Variable speed control follows the demand instead of throttling against a fixed-speed pump, and because power falls roughly with the cube of speed the savings at part load are disproportionately large.
Process industries
Pumps handling dense or viscous fluids need both a density correction and a viscosity derating, since manufacturer curves are published for water. The two effects compound: a viscous fluid needs more power and the pump delivers less head while doing it.
Expert Tips
💡Hydraulic power is ρgQH — everything above it is loss.
💡75% pump and 92% motor efficiency delivers 69% of the electricity to the fluid.
💡Running 15 points below best efficiency cost 25% more energy in the example above.
💡Specific energy in kWh/m³ converts a duty straight into an annual cost.
💡A centrifugal pump draws more power as head falls — size the motor for run-out.
💡Throttling wastes energy by adding head; variable speed moves the curve instead.
Advantages & Limitations
Advantages
✓Separates the three power figures, which are routinely conflated
✓Reports specific energy, the metric that decides purchasing arguments
✓Handles any fluid through its density
✓Warns when a quoted efficiency is implausible for the duty
✓Simple enough to check by hand during a review
Limitations
!Assumes a single steady duty point
!Efficiencies must be supplied; the calculation cannot know the pump curve
!Takes no account of viscosity, which derates both head and efficiency
!Does not check NPSH, which determines whether the pump can operate at all
!Ignores drive losses in couplings, gearboxes or variable speed drives
!Assumes constant density; entrained air or solids change it
!Does not model system curve interaction or parallel pump operation
What Efficiency Costs at a Fixed Duty
50 m³/h against 30 m of head, water, with a 92% motor throughout. The hydraulic power is identical in every row — only the efficiency differs, and with it the electricity.
50 m³/h, 30 m head, water at 998 kg/m³, 92% motor. The fluid receives exactly 4.079 kW in every row. Between the 50% and 82% cases the electricity drawn differs by 3.46 kW — over 30,000 kWh a year on continuous duty, for identical useful work.
Hydraulic power is ρgQH with flow in m³/s. Divide by pump efficiency for shaft power and again by motor efficiency for electrical power. 50 m³/h at 30 m gives 4.079 kW hydraulic and 5.912 kW electrical at 75% and 92%.
What is the difference between hydraulic and shaft power?
Hydraulic power is the work actually done on the fluid. Shaft power is what the pump requires to deliver it, higher by the pump's own losses — recirculation, disc friction and hydraulic losses inside the casing.
What is a good pump efficiency?
70 to 85% for a well-selected centrifugal pump at its best efficiency point. Small pumps are lower, and any pump running well off its design flow will be substantially below its quoted peak.
What is specific energy in pumping?
Electrical energy per cubic metre moved, in kWh/m³. It multiplies straight into an annual cost and compares directly across pumps, systems and sites.
Why does an oversized pump waste energy?
Because it operates left of its best efficiency point, where internal recirculation dominates. The example above shows a drop from 75% to 60% efficiency costing 25% more electricity for identical useful work — plus vibration and accelerated wear.
Should I throttle a valve to reduce flow?
Only as a last resort. Throttling reduces flow by adding artificial head, so the pump still generates head that is then destroyed across the valve. A variable speed drive moves the pump curve instead and saves the energy outright.
How much power does a pump need for a denser fluid?
Proportionally more. Power is directly proportional to density, so a fluid at 1,200 kg/m³ needs 20% more power than water for the same flow and head.
What motor size should I specify?
Above the shaft power at the duty, with margin for run-out. A centrifugal pump draws more power as head falls, so a motor sized exactly to the design point can overload when system resistance is lower than assumed.
Why do variable speed drives save so much on pumps?
Because power falls with roughly the cube of speed on a friction-dominated system. Running at 80% speed can draw about half the power, which is why part-load savings are disproportionately large.
Does this calculation tell me if the pump will cavitate?
No. It gives the power required. Whether the pump can draw the fluid in depends on the net positive suction head available against what the pump requires, which is an entirely separate check.
Glossary
Hydraulic power
The rate of work done on the fluid, ρgQH.
Shaft power
The power the pump requires at its shaft, including its internal losses.
Total head
Static lift plus friction losses plus any pressure requirement, in metres.
Best efficiency point
The flow at which a pump is most efficient; efficiency falls away either side.
Duty point
Where the pump curve intersects the system curve — the flow and head actually delivered.
Specific energy
Electrical energy per cubic metre pumped, in kWh/m³.
System curve
Head required against flow for the pipework, rising roughly with the square of flow.
Run-out
Operation at maximum flow and minimum head, where a centrifugal pump draws most power.
Impeller trimming
Reducing impeller diameter to lower the pump curve permanently.
Recirculation
Internal flow reversal at low flow rates, wasting energy and causing vibration.
Scientific & Standards References
ISO 9906 — Rotodynamic pumps: Hydraulic performance acceptance tests — International Organization for Standardization
ANSI/HI 1.3 — Rotodynamic Centrifugal Pumps for Design and Application — Hydraulic Institute
Karassik, I. J. et al., Pump Handbook, 4th Edition — McGraw-Hill
Europump and Hydraulic Institute, Variable Speed Pumping: A Guide to Successful Applications — Elsevier
EU Regulation 547/2012 — Ecodesign requirements for water pumps — European Commission
Conclusion
Hydraulic power is fixed by the duty — ρgQH and nothing else — so every difference between pumps at the same flow and head is a difference in loss. The table above makes that concrete: the fluid receives exactly 4.079 kW in every row, while the electricity drawn ranges from 5.41 to 8.87 kW depending purely on pump efficiency. On continuous duty that spread is over 30,000 kWh a year for identical useful work, which is why efficiency at the actual duty point matters more than almost any other selection criterion. Two things follow. Read efficiency from the curve at the flow you will actually run, not from the peak on the datasheet, because a pump 15 points off its best efficiency point cost 25% more in the worked example. And where flow varies, move the pump curve with a variable speed drive rather than throttling against it — a valve reduces flow by creating head that the pump has already paid to generate.
Enter your flow, head and efficiencies above to get the power and the running cost.